
Case study
From banking app to business partner
Mobile • 3 months • Q4 2024
Project details
My role
Lead Product Designer responsible for end-to-end delivery. From framing the problem, planning and executing research, leading workshops and ideation, to prototyping, validation, and shipping. I also updated and extended the design system to support the new UI components.
The team
I worked as part of a product trio (myself, Product Manager, Lead Developer) within a cross-functional team of five, including two developers. We collaborated daily to shape and test solutions, involving both developers and key stakeholders throughout discovery and design to gather input and perspective.
Overview
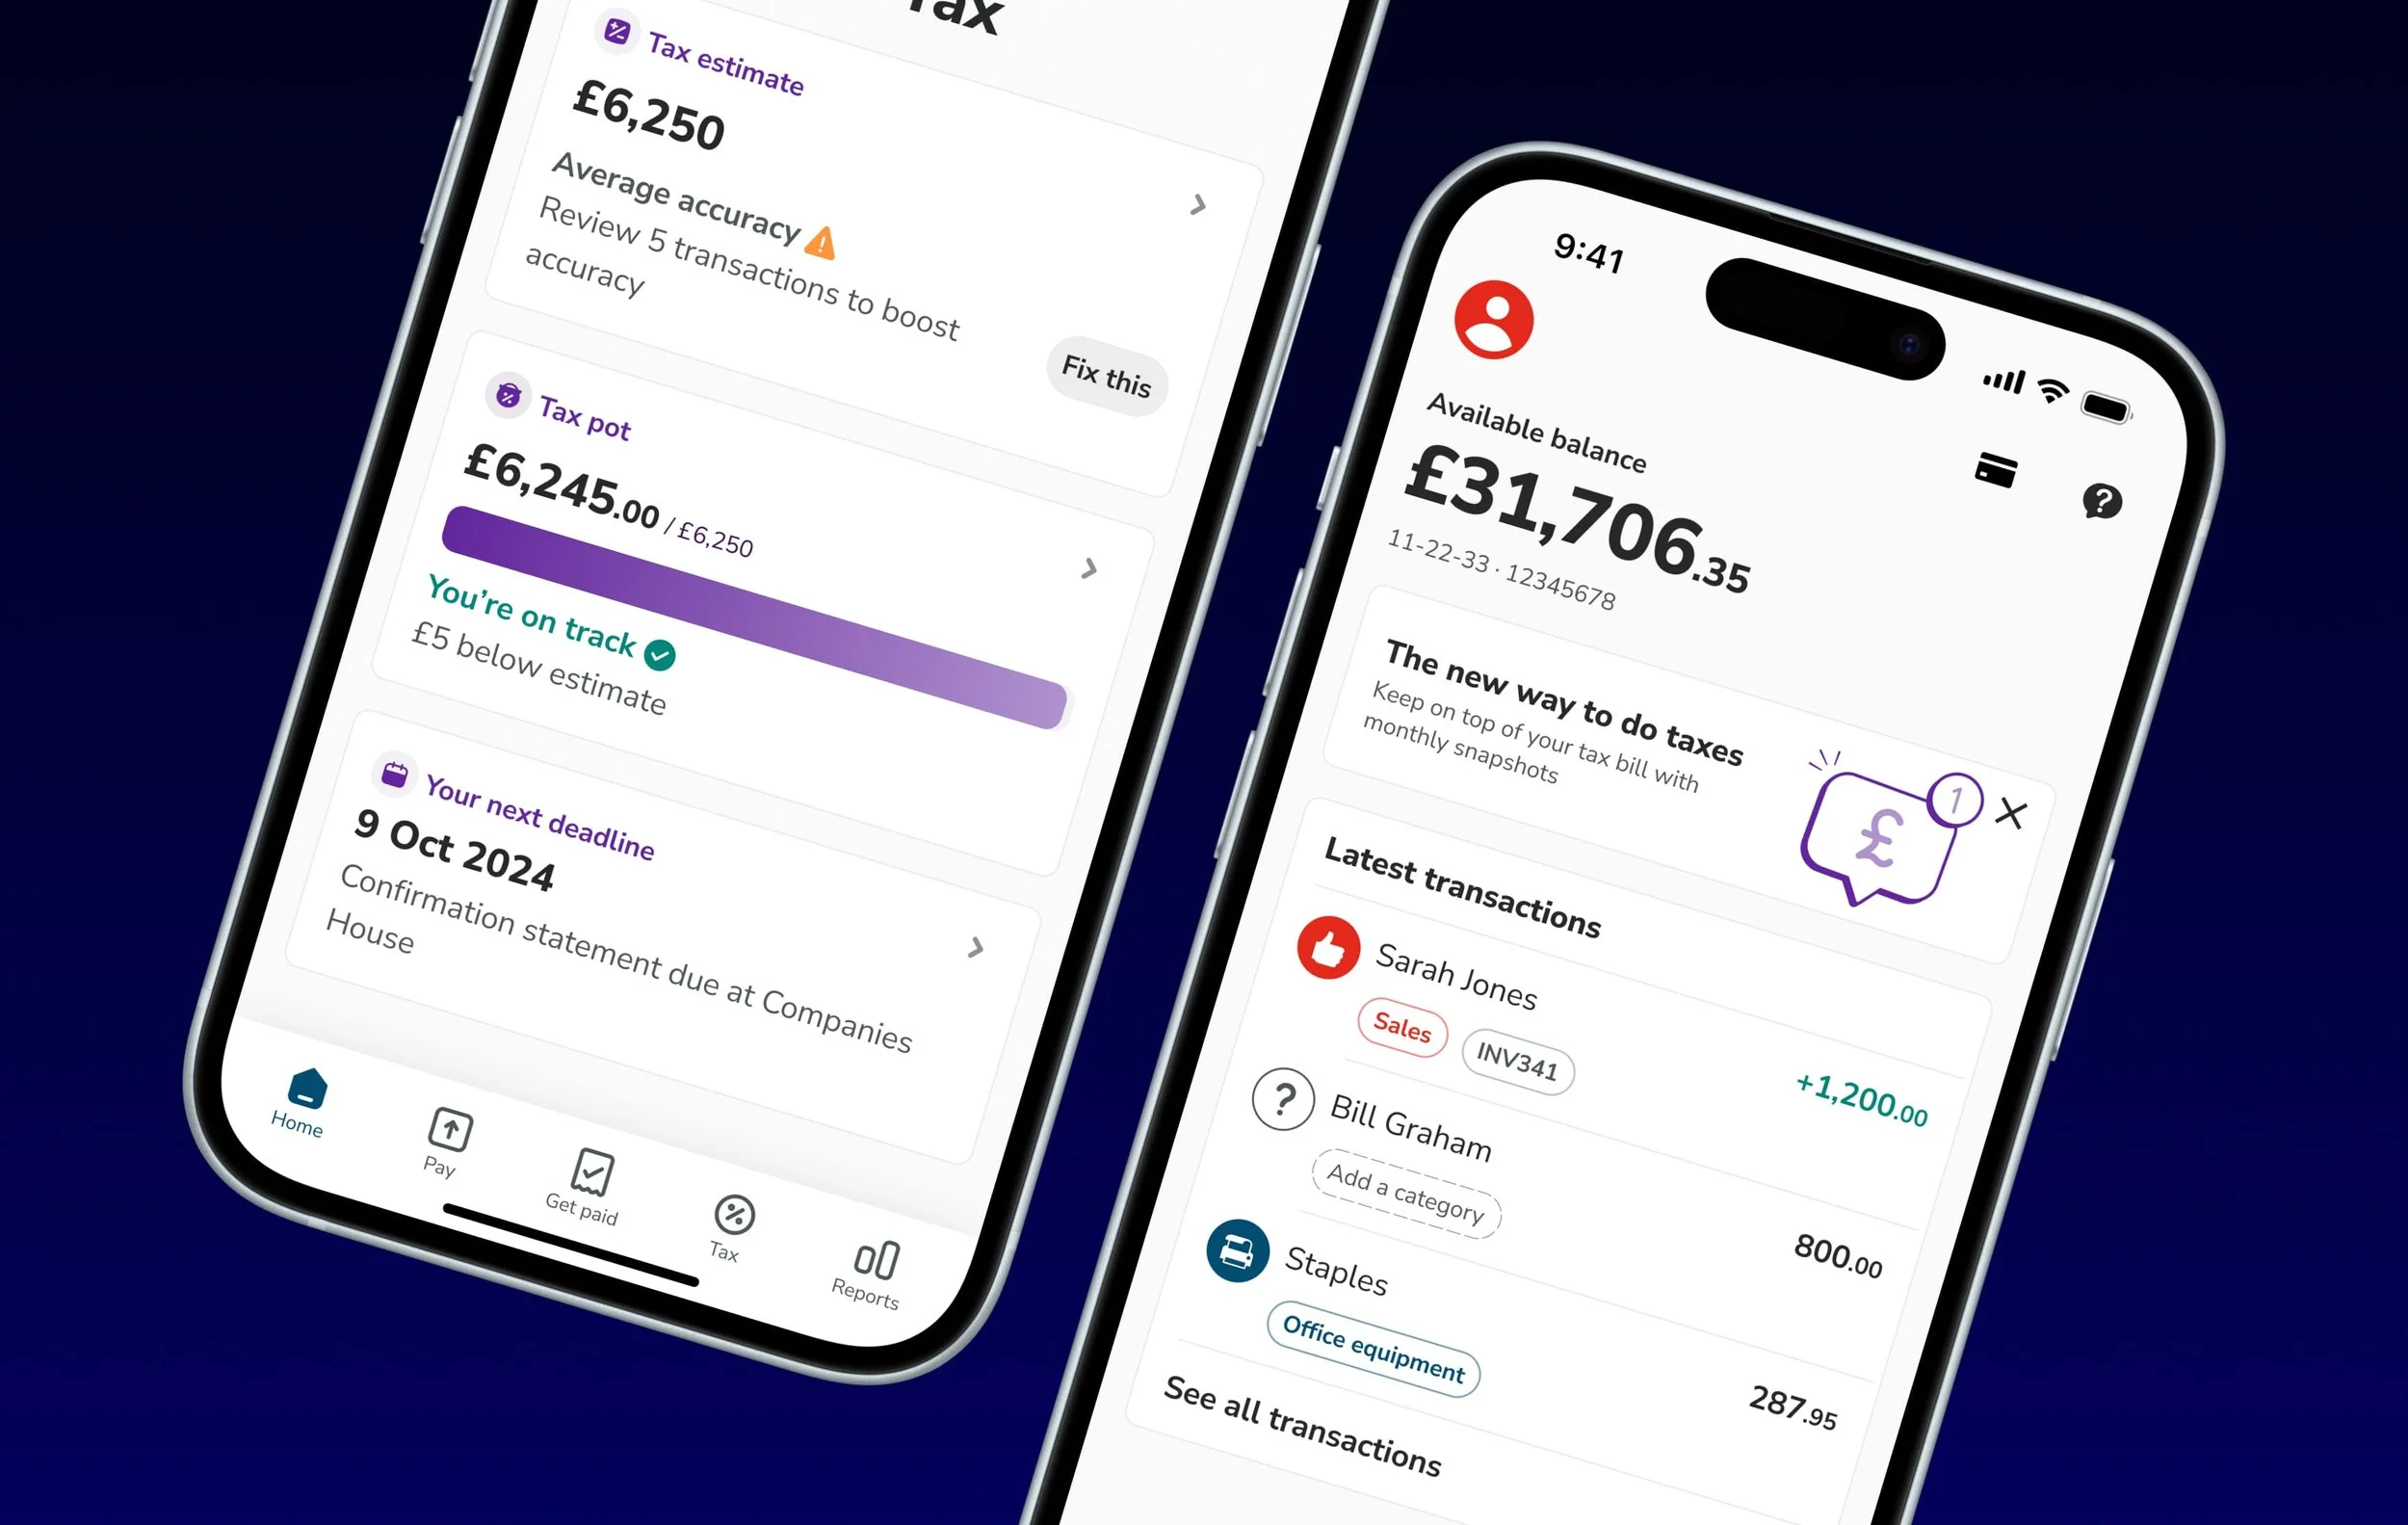
Most users saw Countingup as just a business bank account, unaware it also offered powerful built-in accounting tools. This project set out to change that. By redesigning the home screen, we aimed to shift user perception, surface key business insights like tax estimates and upcoming deadlines, and drive engagement with features proven to boost retention. The result was a home experience that helped users see Countingup not just as a bank, but as a powerful accounting assistant, and a clear uplift in key behaviours followed.
The process
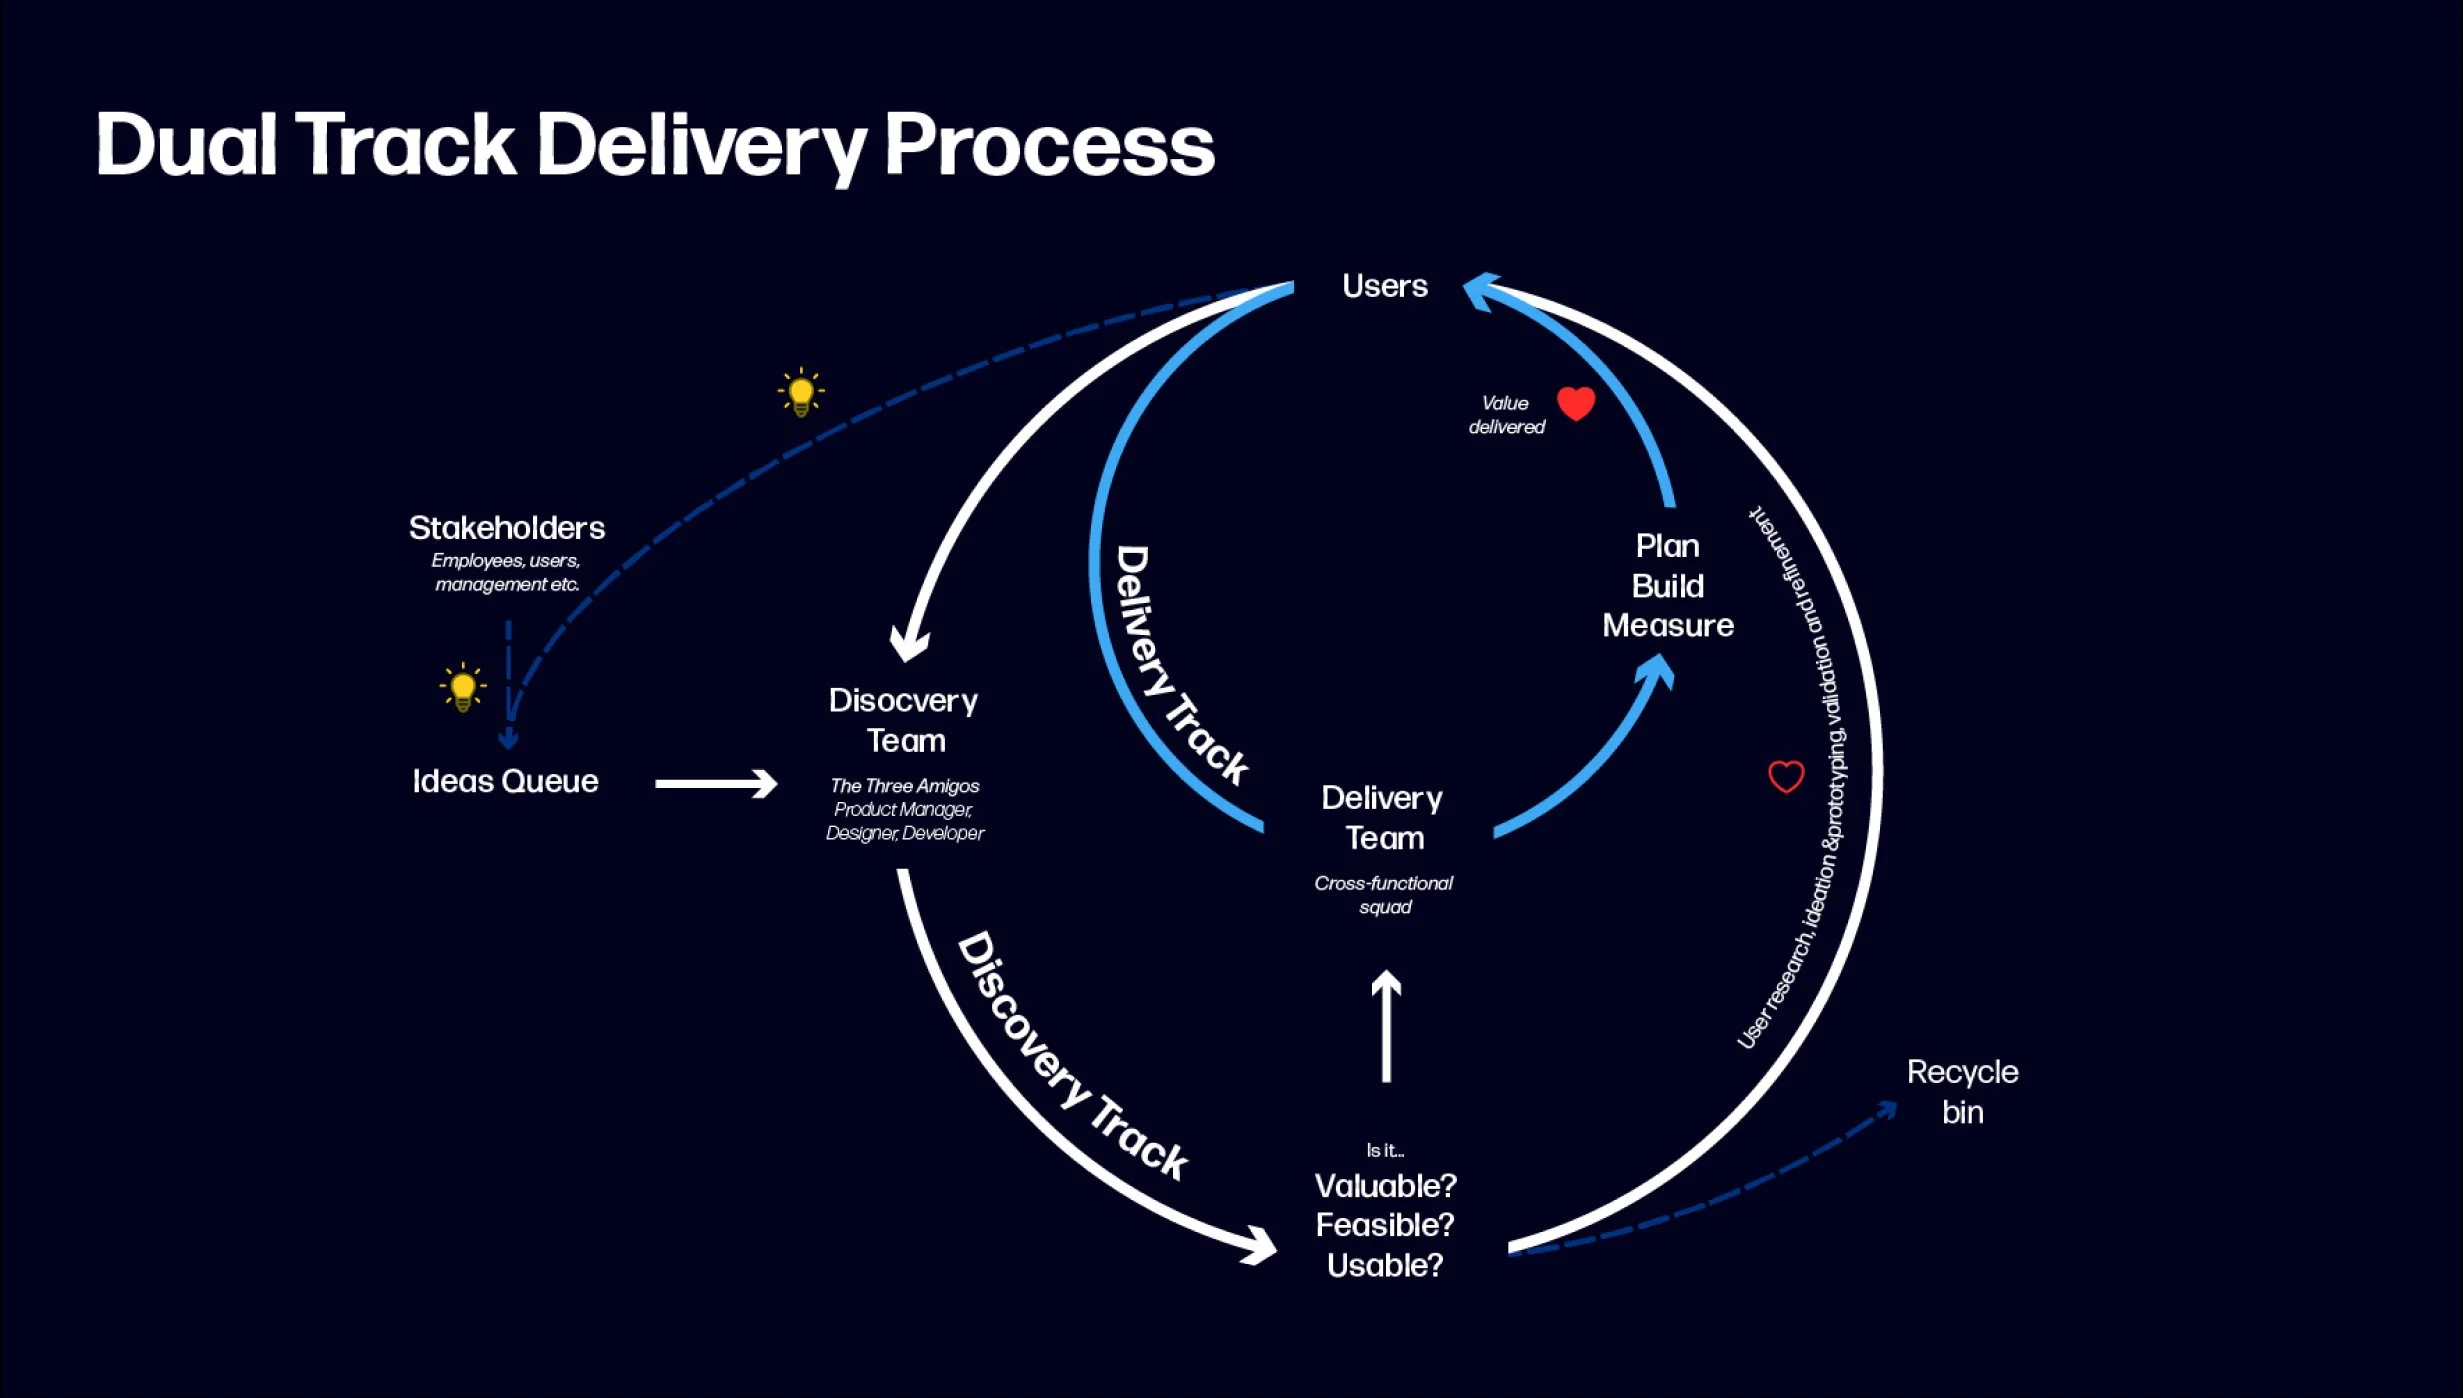
At Countingup, we followed this process when collaborating within our cross-functional teams. While at Countingup, I recognised the need for a consistent product design and delivery approach across squads and led the process of workshops where we discovered and defined our process. In these workshops with the Head of Design, CTO, and wider teams of developers and product managers, we streamlined our workflow into two tracks, Discovery and Delivery.
The Discovery track focuses on validating customer needs and testing ideas, while the Delivery track ensures efficient execution of those validated solutions. This approach allows us to innovate quickly without slowing down development, ensuring we build the right products and ship them rapidly.
The problem
Most users saw Countingup as just a business bank account, unaware that it also offered built-in accounting tools. As a result, adoption of these features was low, contributing to higher churn after the first year. Data showed that users who engaged with at least one accounting feature were significantly more likely to stay long term. Our goal was to increase awareness and engagement with these tools, as a strategy to improve customer retention.
Reviewing the data
Most active users engage only with banking features, such a card payments and bank transfers.
Users who use only banking features tend to churn within their first year.
Users who engage with at least one accounting feature, such as invoicing or checking profit and loss, are significantly more likely to stay long-term.
Accounting features suffer from low discoverability in the current experience.
The most-used accounting tool is accessed by only a small minority of users.
This highlighted a clear opportunity, if we could improve discoverability and usage of accounting tools, we might meaningfully increase long-term retention.
Stakeholder workshop
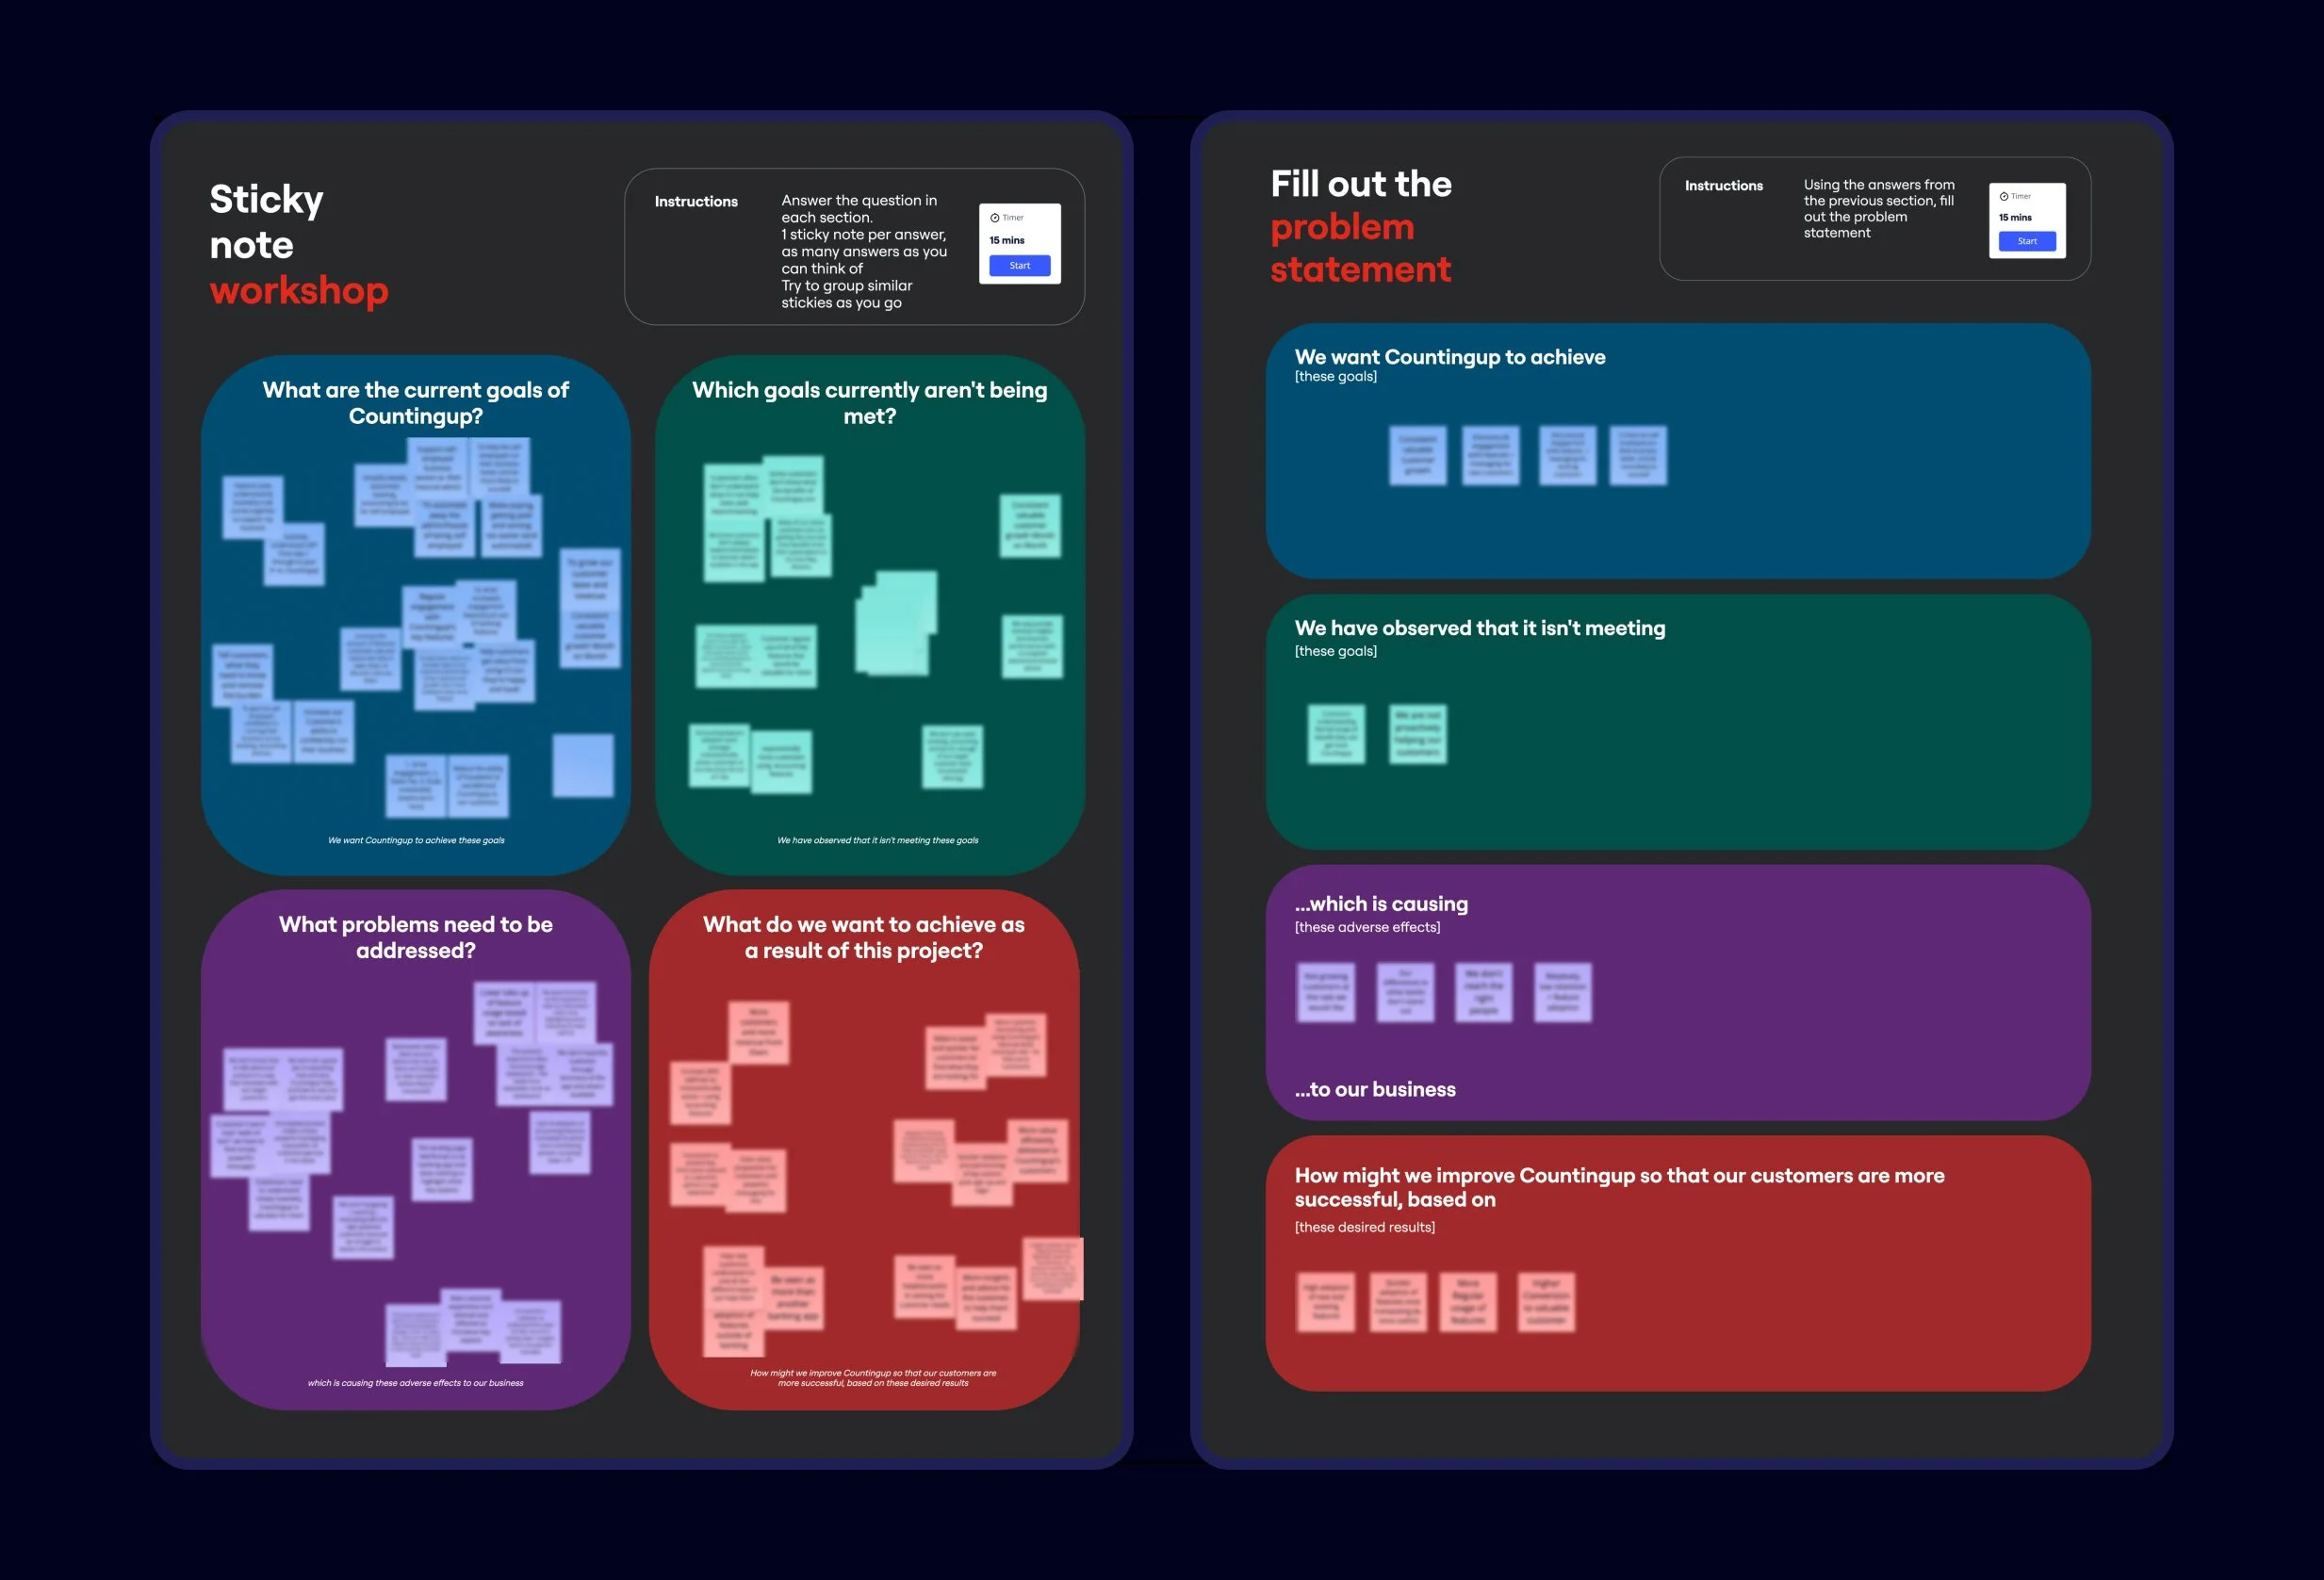
In the past, the Senior Management Team had expressed concerns about making changes to the home screen, seeing it as a high-risk area central to the brand and product perception. Once it became clear this project could require adjustments to the home experience, I proactively brought the SMT into the process early by running a Problem Statement workshop to surface their perspectives, align on goals, and build shared confidence in the direction.
The outcome of the workshop lead to this problem statement
Countingup was designed so self employed people can run their business confidently. We have observed that our users do not understand our full business proposition, which is causing low engagement with features beyond transacting resulting in low retention and no customer growth. How might we improve Countingup so that our customers are more successful based on their engagement with our easy admin, insights and tax features?
Support team workshop
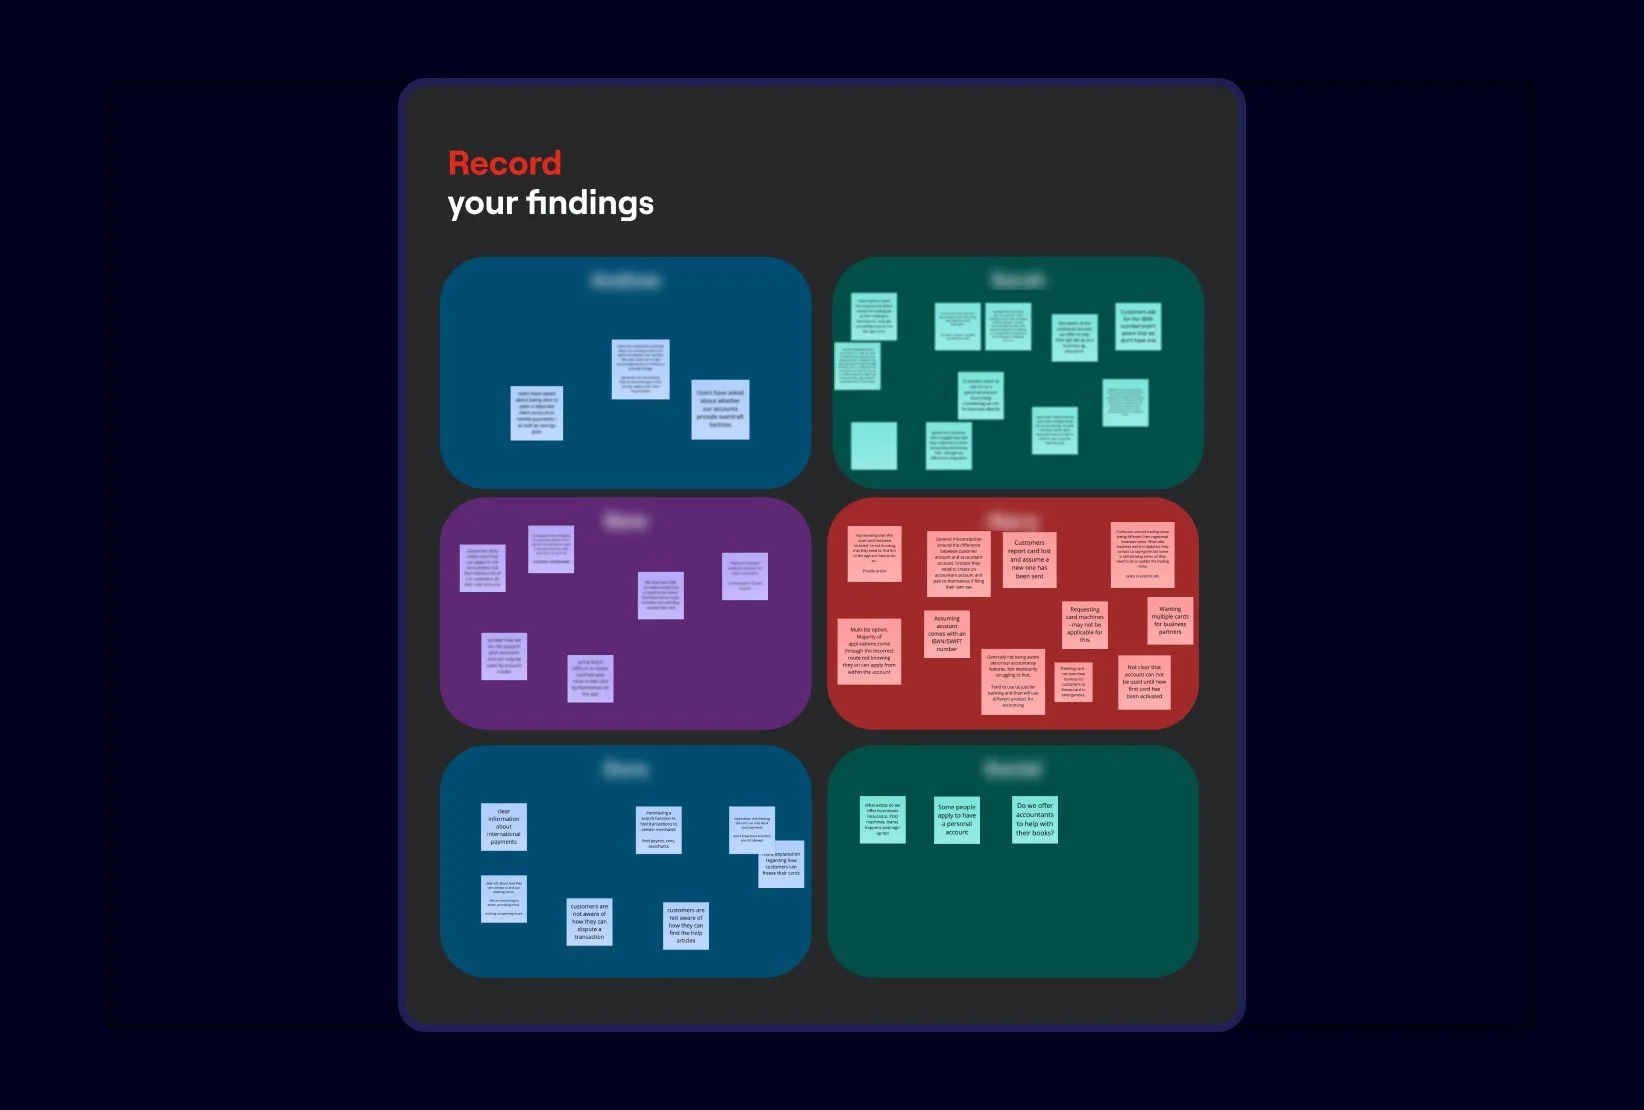
I ran a workshop with the Customer Support and Success teams. These teams have daily contact with customers and offered valuable perspective on common issues users face when navigating the app.
Key findings from this workshop
Many users contacted support for help finding features like freezing a card, accessing tax reports, or changing their trading name. This reinforced our understanding that core tools were not easily discoverable.
Support teams often received requests that indicated a misunderstanding of the product offering. Some users applied for a personal account, or asked if they could open a second business account, highlighting confusion about our core offering.
A common question was whether we provided access to accountants, showing that many users misunderstood the nature of our accounting features as self-serve tools, not a managed service.
Assumptions workshop
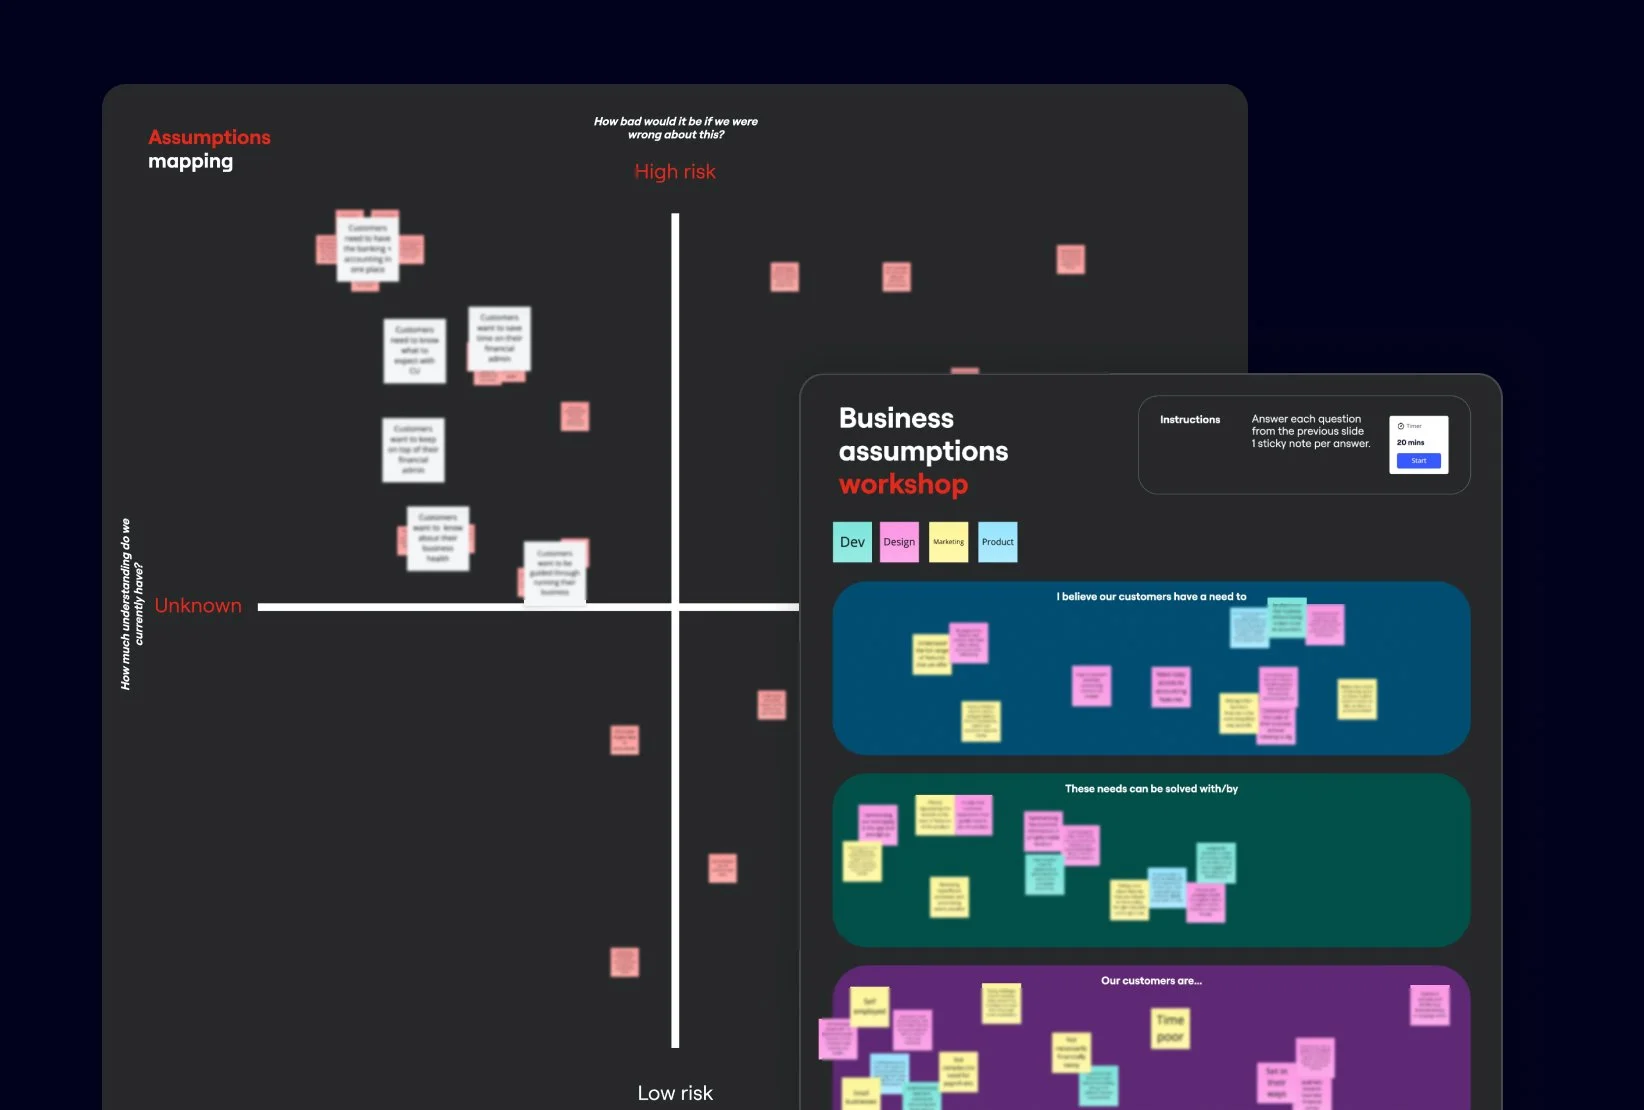
To align the team and surface potential blind spots, I ran an assumption collecting workshop. Using a structured set of prompts, we documented our beliefs about our users, the business, and the product’s value.
We answered a broad set of questions, covering who are customers are, the value they’ll receive if we solve the identified problem, what are the potential risks and how do we plan to solve the problem. Once collected, we plotted each assumption on a 2×2 matrix, measuring risk against how much we already knew.
From this, we identified our highest-risk, lowest-certainty assumptions and translated them into testable hypotheses
If we improve how we communicate the value of Countingup, more users will convert from signup to paid.
If we guide users through their business lifecycle, they will feel more confident in managing their business.
If we provide regular insights into business performance, users will become more engaged and loyal.
If banking and accounting are integrated, users will stay with the product longer.
If we automate key processes, users will save time and feel more in control.
Research plan
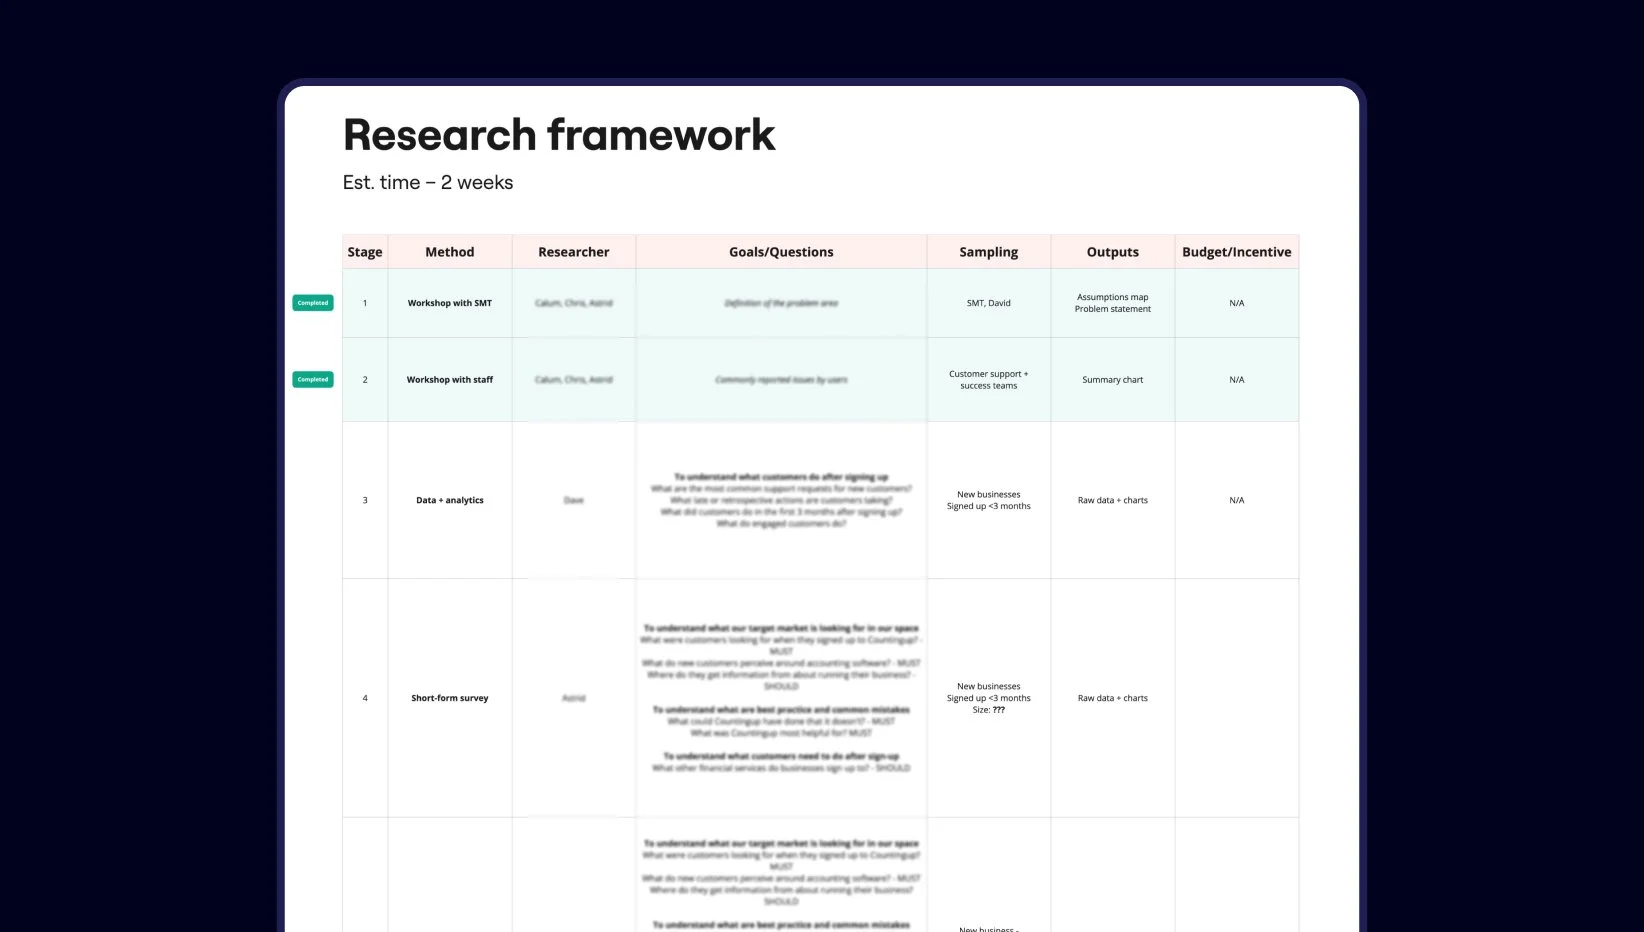
Following these workshops, the product trio set about creating a research plan. We followed a process where we defined the questions we wanted to answer based on each hypothesis, and assigned the best research methodologies to answer those questions.
The resulting research plan included product analytics, a long-form user survey, one-on-one interviews, and competitor benchmarking.
User survey

I created a survey where the goal was to identify gaps between user understanding of our accounting features and actual behaviour. We received responses from ~150 users exploring awareness and perception of Countingup’s accounting features.
Key insights from the survey
Over 3/4 were aware of key accounting features
Over 3/4 rated the accounting tools 4 or 5 out of 5 for usefulness
The top rated features were Invoice creation, accounting reports and tax pots
Despite this, most described Countingup as just “a business bank account” when asked to explain it to a friend
Over half reported no access issues to features; among the rest, the hardest to find were accounting reports, tax estimates, and invoice creation
The most viewed features in the last week were transactions, account details, profit and loss, invoices, tax estimates
Survey responses revealed much higher awareness and appreciation of accounting features than product analytics suggested. While usage data showed these tools were underutilised, the survey indicated that users saw value in them, pointing to an issue of discoverability and surfacing, rather than feature quality.
It’s worth noting that these responses likely reflect a more engaged segment of our user base, which may skew results more positively than the broader user base.
User interviews

I led one-on-one interviews with 10 self-employed users who had signed up in the last 6 months. I created a script that focused on four key research areas: what new customers are looking for; common behaviours, best practices, and mistakes; what happens after they sign up; and how users perceive Countingup and its accounting tools.
Key insights from the interviews
Most users log in 3–4 times a week to check their balance, but rarely explore beyond core banking tasks
Those who did use accounting features like reports, tax estimates, or transaction categorisation described them as valuable and time-saving
Some users found the tax estimate feature helpful but questioned its accuracy before the end of the tax year
In a card sorting exercise, users ranked financial insights, such as tax estimates and profit, as second only to balance in terms of home screen importance
Users consistently praised the app’s overall simplicity and ease of use
These sessions revealed that while users appreciated the accounting features once discovered, they remained underused due to a lack of exploration. Users primarily focused on banking-related actions unless prompted otherwise. However, when they did engage with accounting tools, they found them genuinely useful.
Competitor analysis

I reviewed multiple leading business banking and accounting apps across the UK and global markets, such as Monzo, Tide, QuickBooks, and Xero.
I noticed a shift away from transaction-only home screens toward dashboard-style overviews.
Banking app dashboards often surface high-value actions such as savings pots, unpaid invoices, tax estimates, and tasks requiring user attention.
Accounting platforms consistently use dashboards to summarise complex data, making key insights, such as profit and loss reports, quickly accessible.
Defining success
Based on product data, we knew that users who engaged with any accounting feature were significantly more likely to retain beyond their first year. Our goal was to shift behaviour in that direction.
To measure success, we defined the following targets
A 1.5× increase in the number of users engaging with any accounting feature.
Leading indicator
A 1.3× increase in the average tenure of the user base
Lagging indicator
We defined engagement as the use of any accounting-related tool; including creating an invoice, viewing profit and loss reports, updating categories, or using tax features such as the Tax Estimate or Tax Pots.
While some of these actions are more active than others, we grouped them together to reflect a broader shift in behaviour, from using Countingup purely for banking to exploring its accounting capabilities.
Ideation workshop
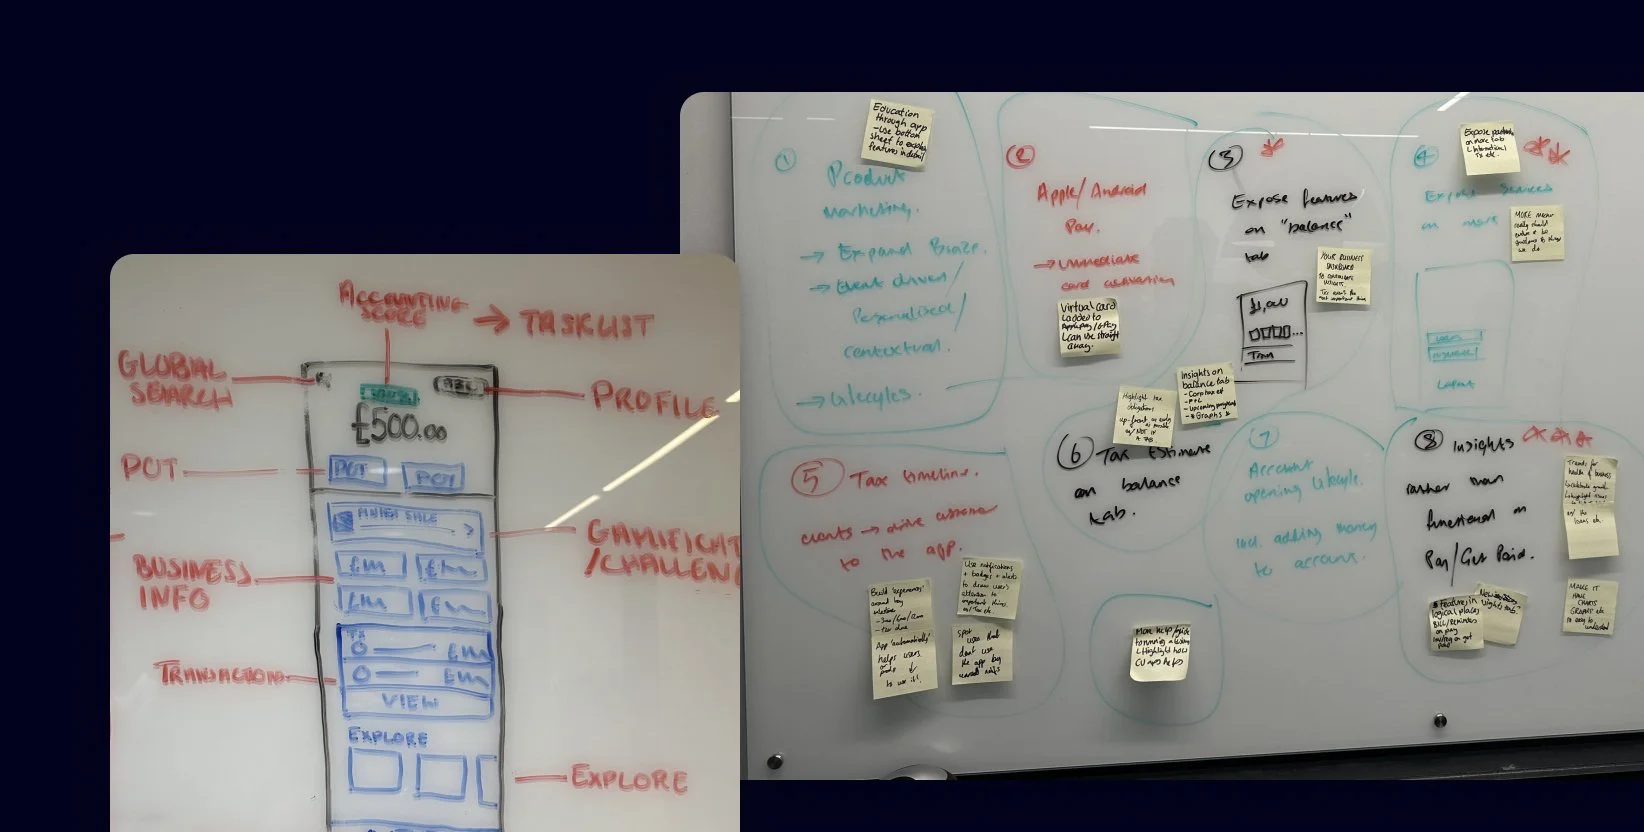
Following the conclusion of the generative research, I facilitated an ideation workshop with the cross-functional team. The session began by revisiting the problem statement and hypotheses, followed by a review of key research findings. We then engaged in multiple rounds of Crazy 8s exercises, using “How Might We” questions to prompt divergent thinking.
From the session, we identified the following ideas to explore
Create more space for diverse content on the home screen by contracting the transaction list into a module showing only the latest few transactions.
Surface accounting insight modules, such as “Profit this month”, “Tax estimate”, and “Tax savings balance”.
Encourage interaction with accounting functionality through contextual tasks tailored to the business’s activity.
Introduce an Accounting Score, which highlights the health and completeness of a user’s business accounting.
Make account settings more accessible by introducing a profile icon on the home screen (currently hidden within the Explore tab).
We decided to break the work into two phases. Phase 1 would focus on the bulk of the work, surfacing accounting insight modules. Phase 2 would introduce changes to the balance section design and the profile banner. This sequencing was intended to minimise the amount of visual change users experienced at once, reducing the risk of a knee-jerk reaction to an updated home screen.
Phase 1
Wireframes
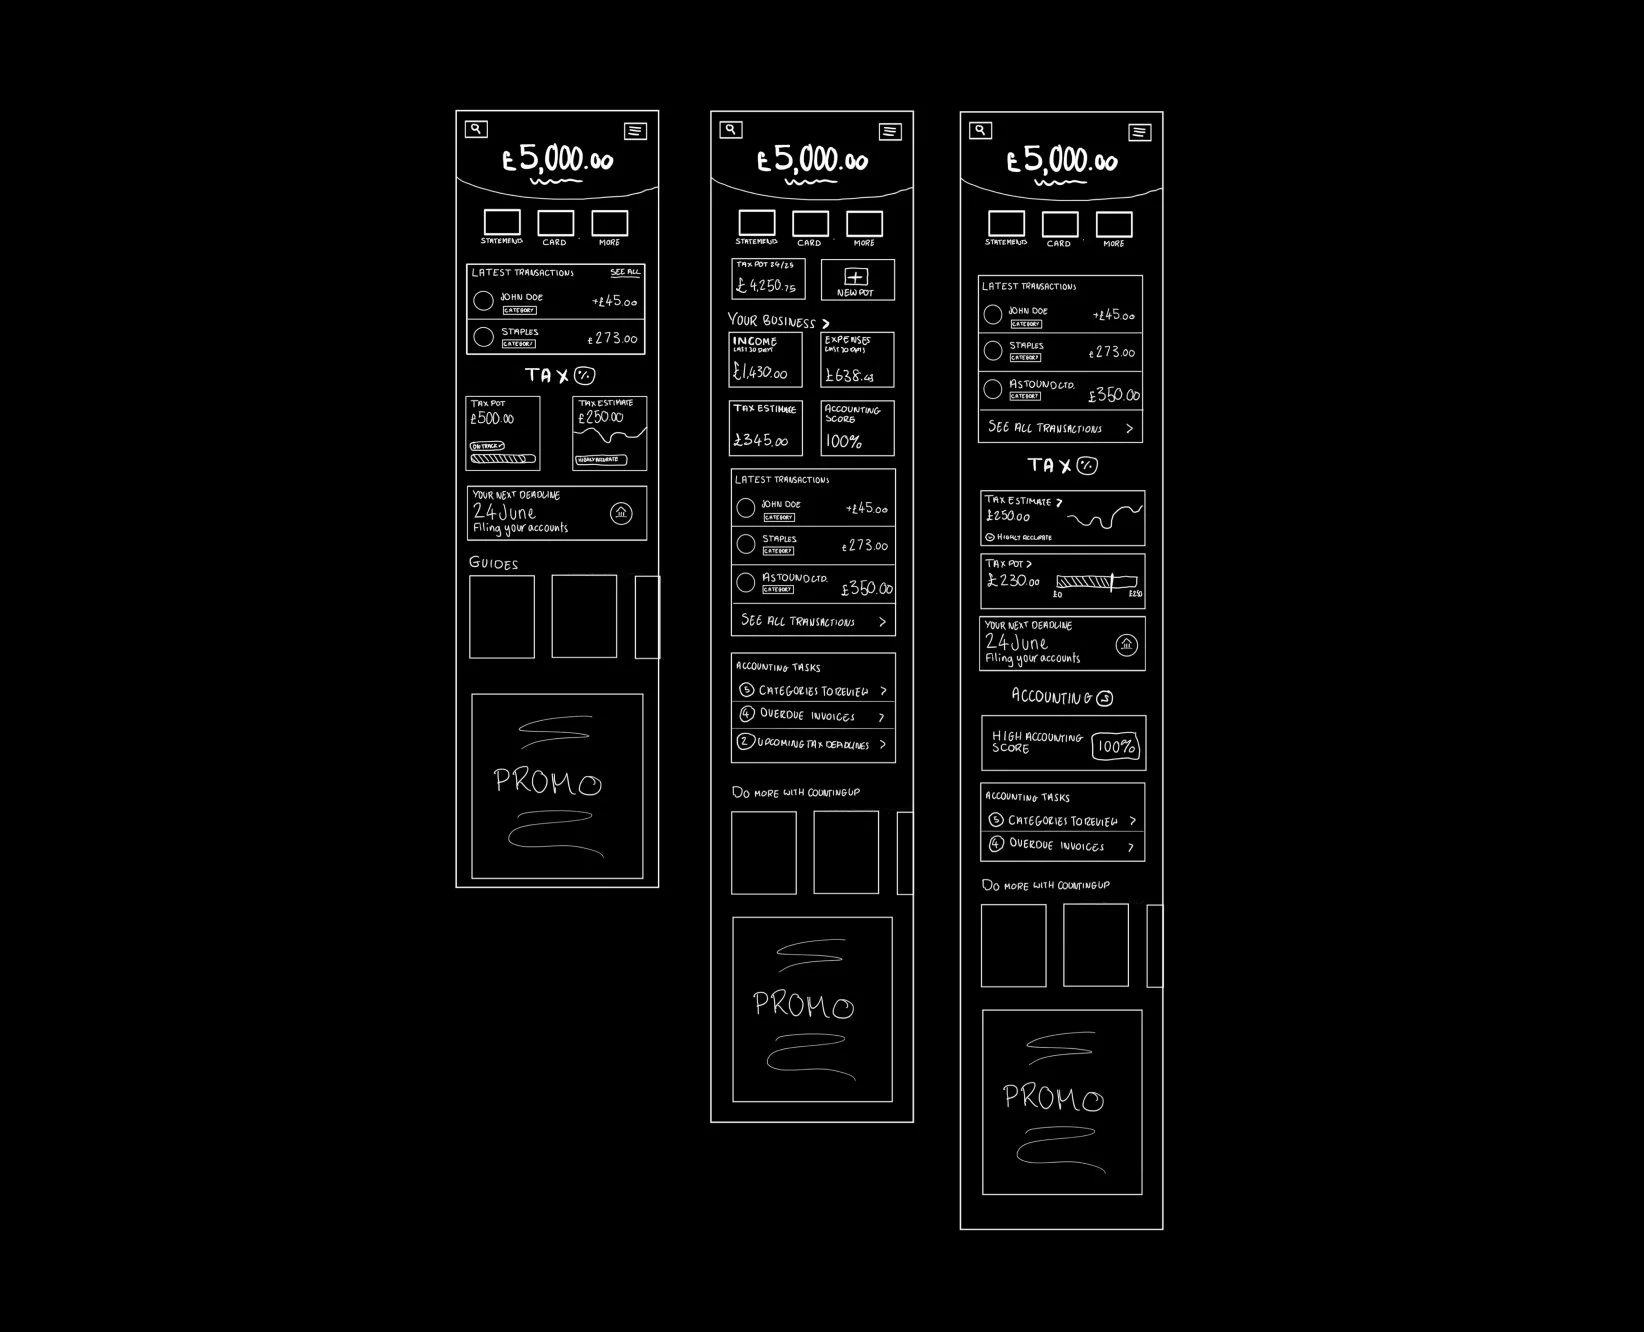
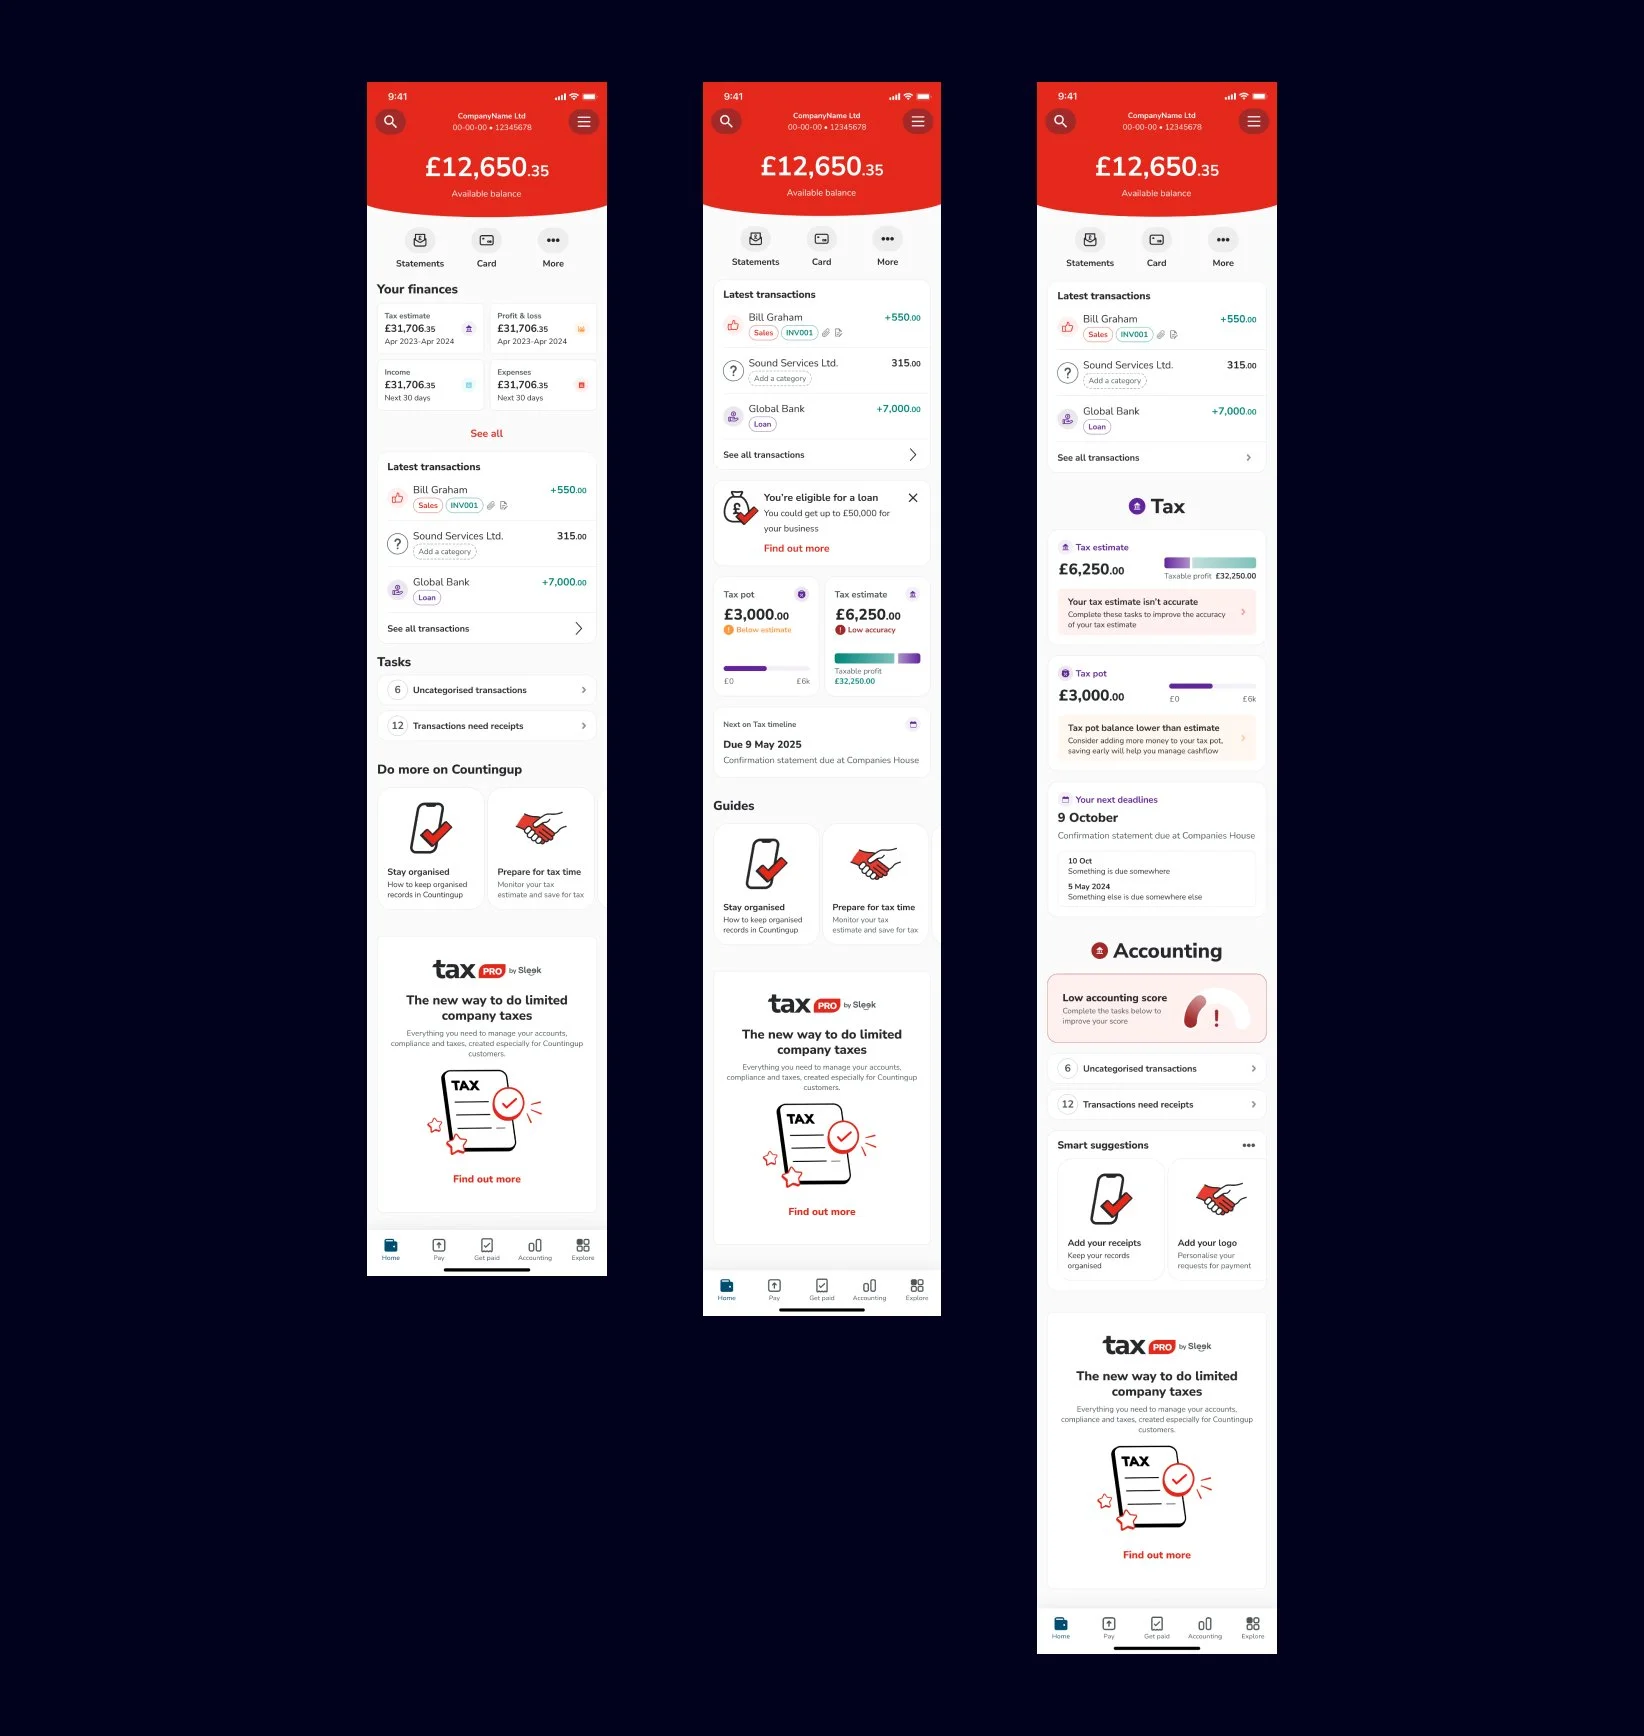
I created a range of wireframes exploring different ways to present and organise the home screen content. I shared these with the cross-functional team and the Senior Management Team to gather feedback and alignment.
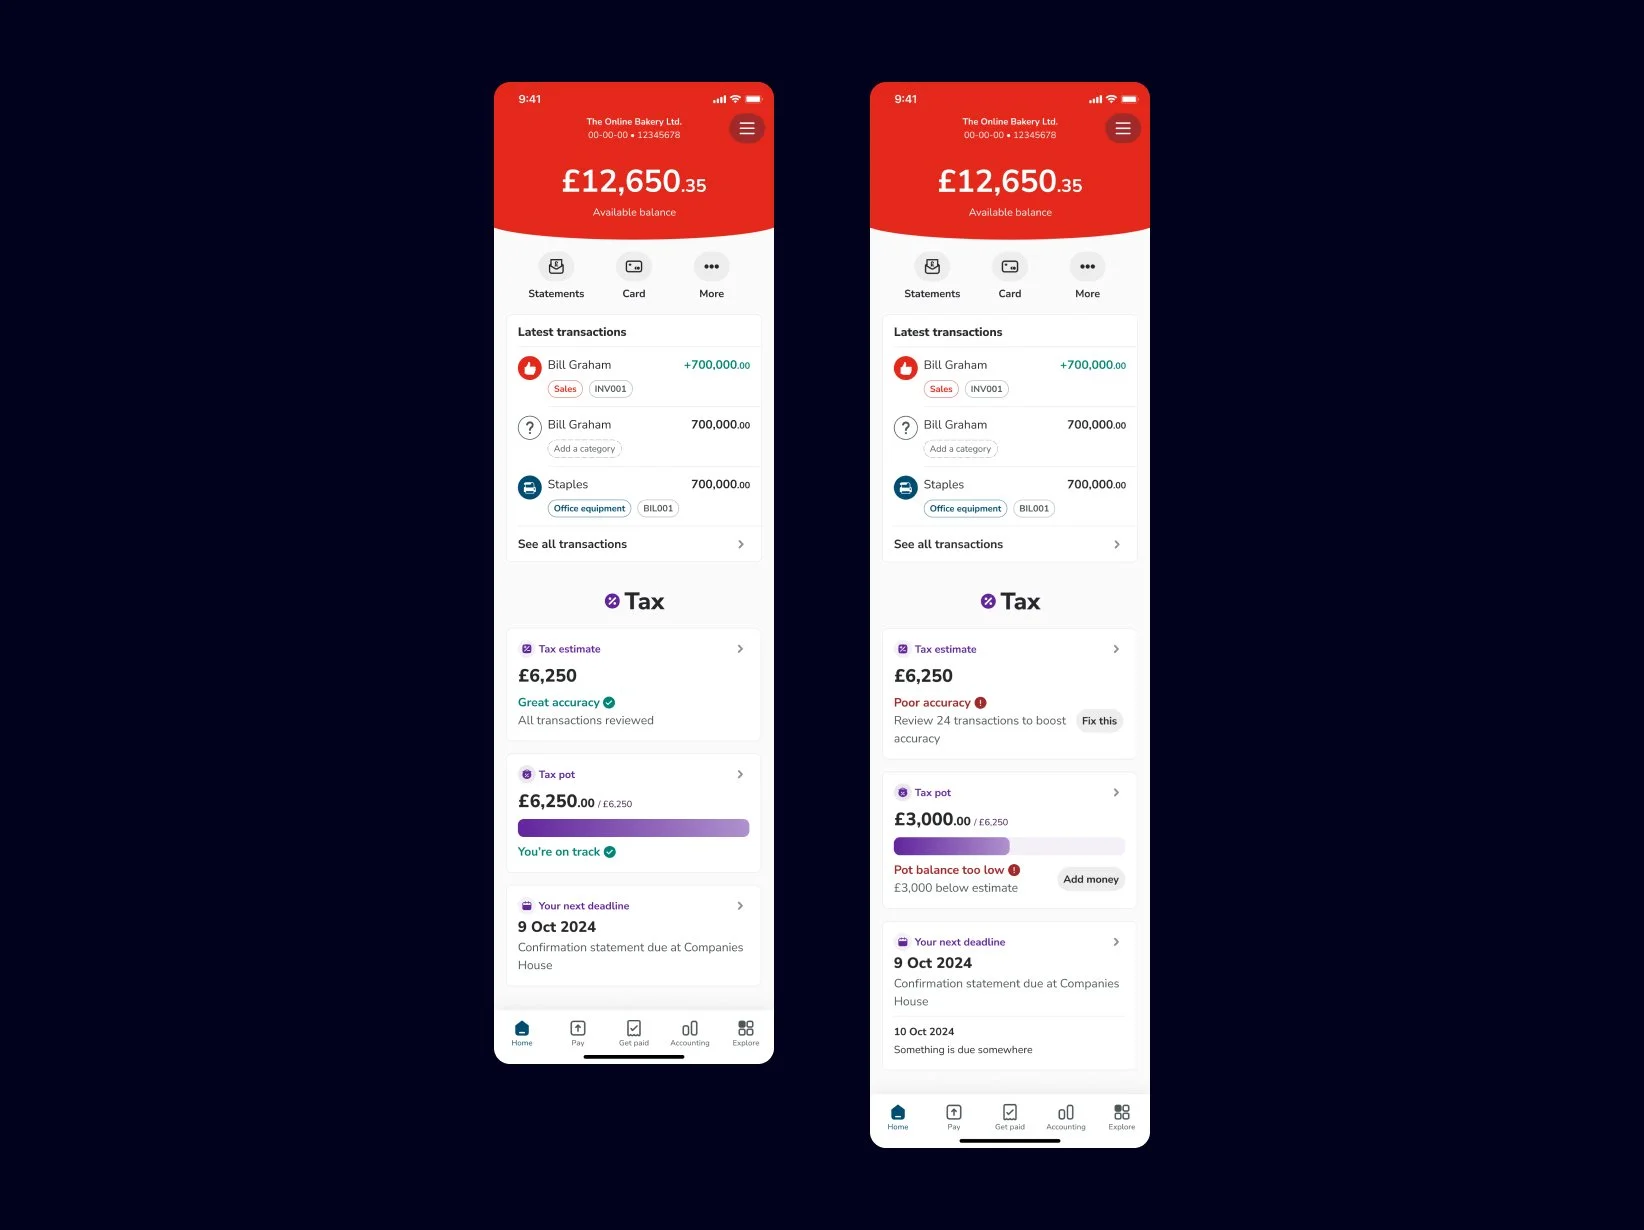
The team felt most confident in the approach that introduced a dedicated “Tax” section. This aligned with the company’s strategic focus on tax filing as a core value proposition, using tax tools as a hook to encourage users to sign up and engage.
First phase designs
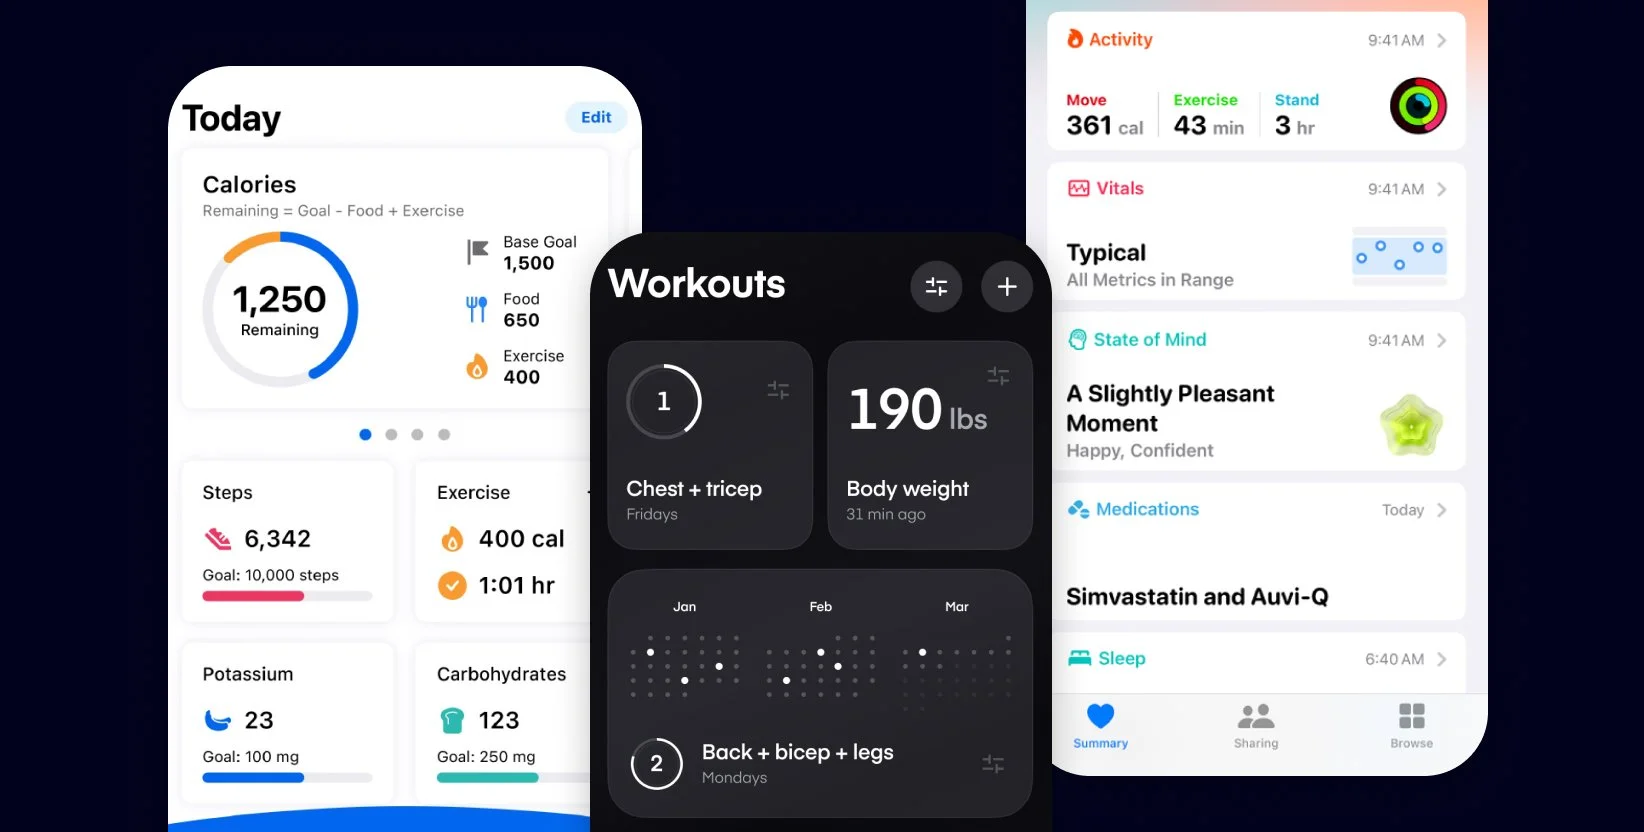
I was inspired by health and fitness apps, which present diverse and complex data in a digestible summary format. These interfaces allow users to quickly understand their overall health at a glance, while making it easy to dive deeper into specific metrics. I saw strong parallels between this and how we wanted to represent the “health” of a business on the home screen.
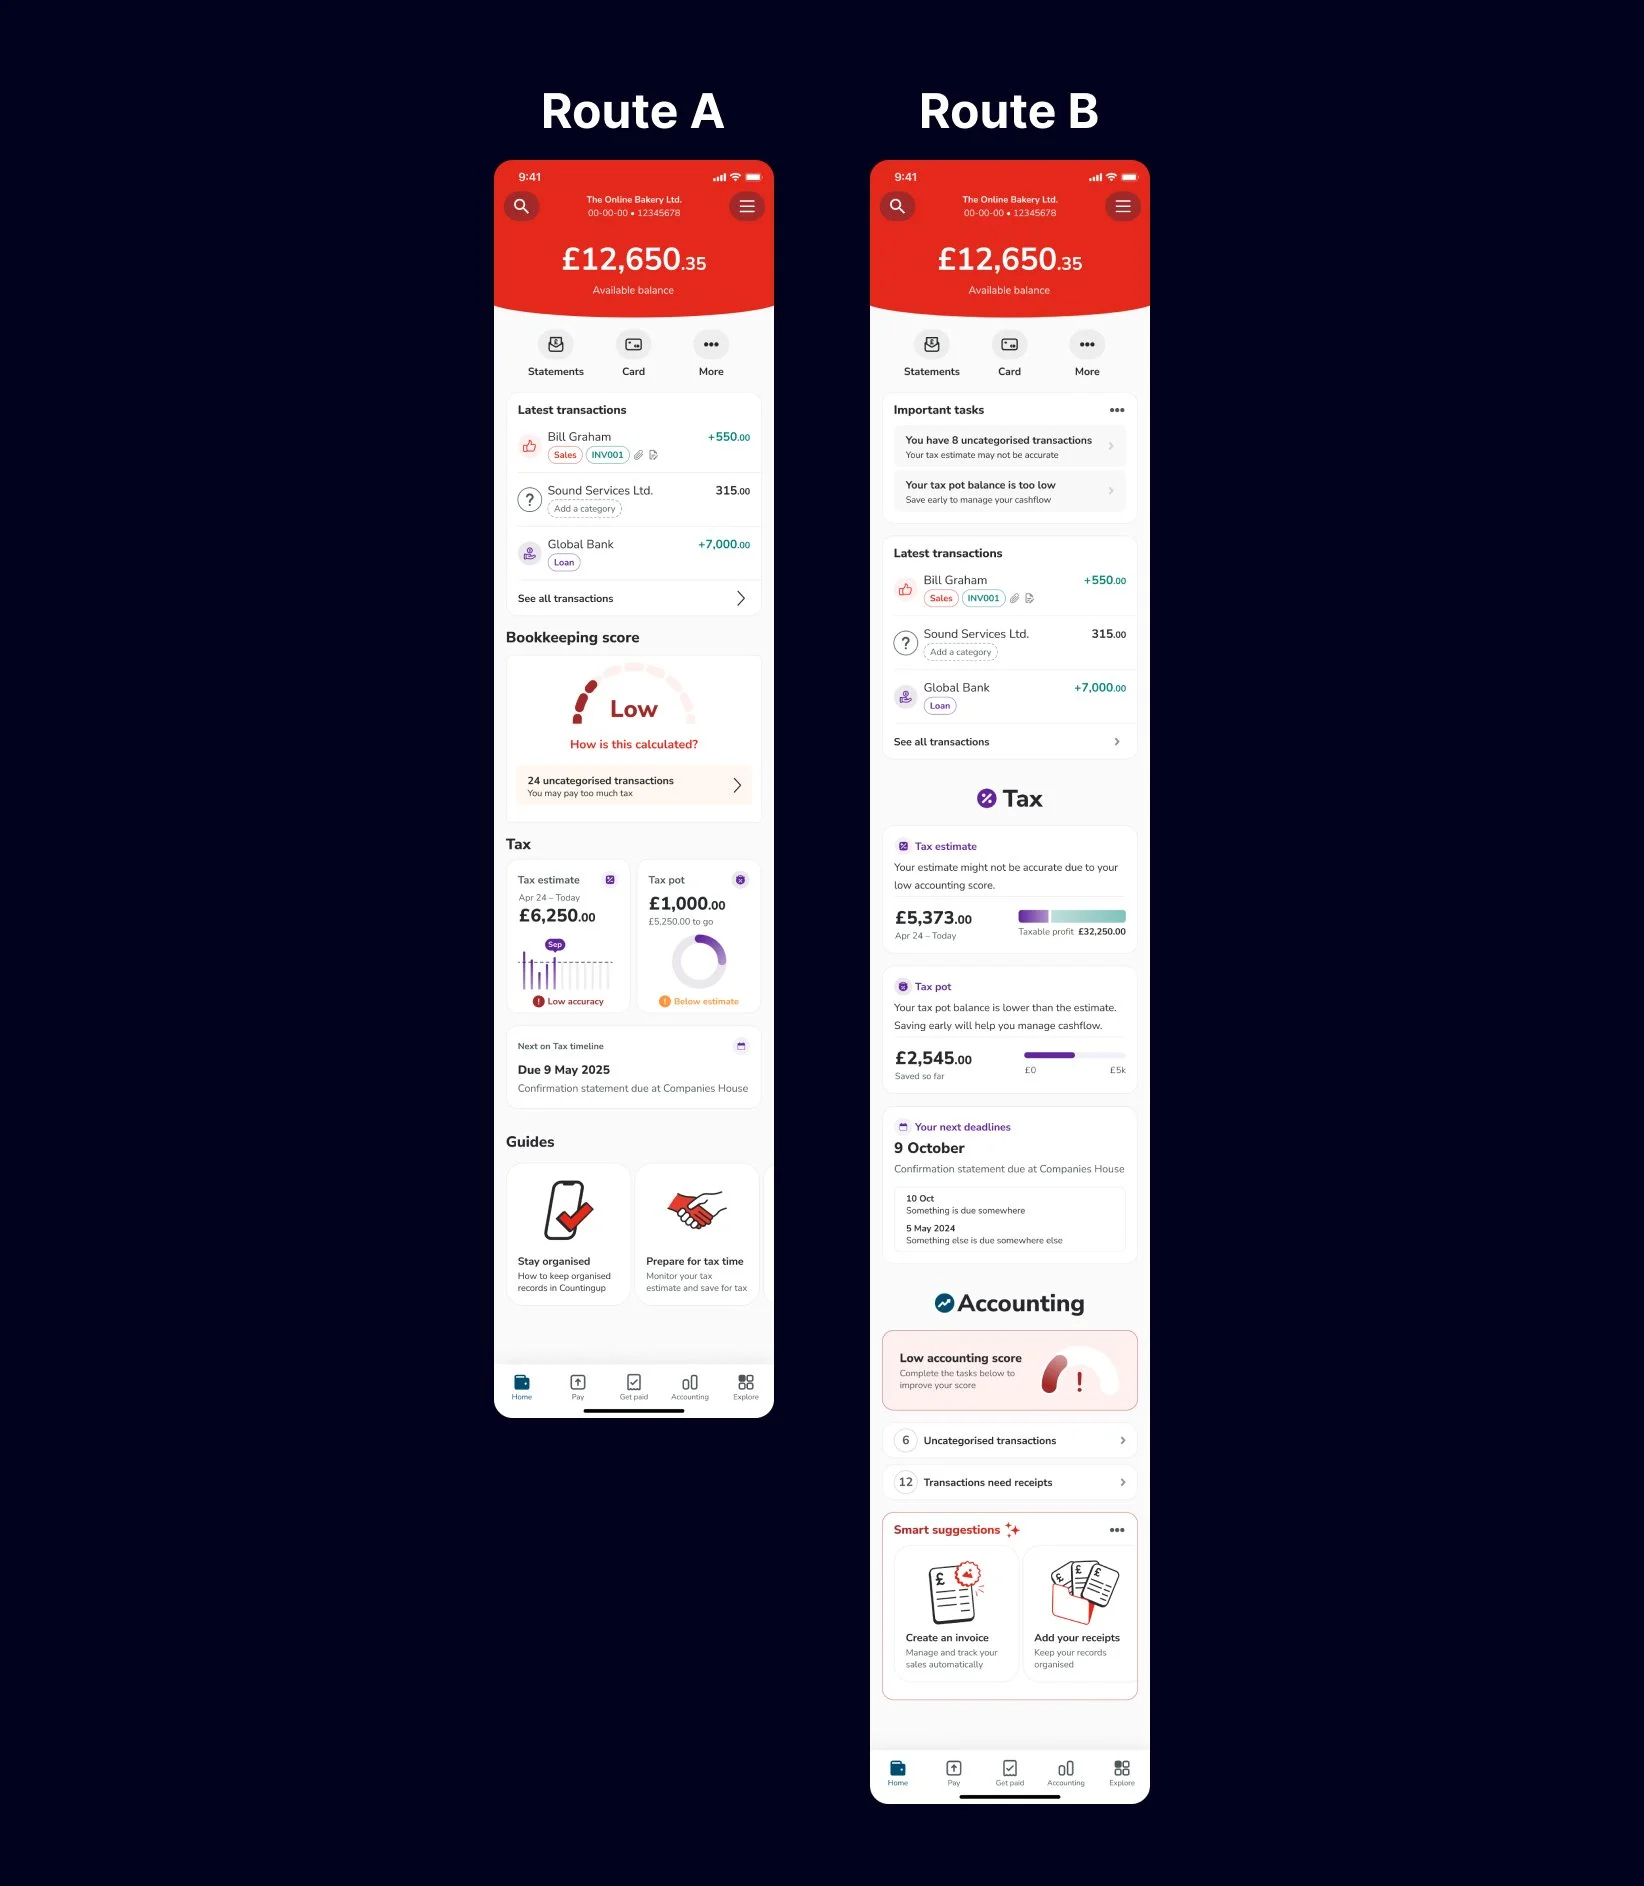
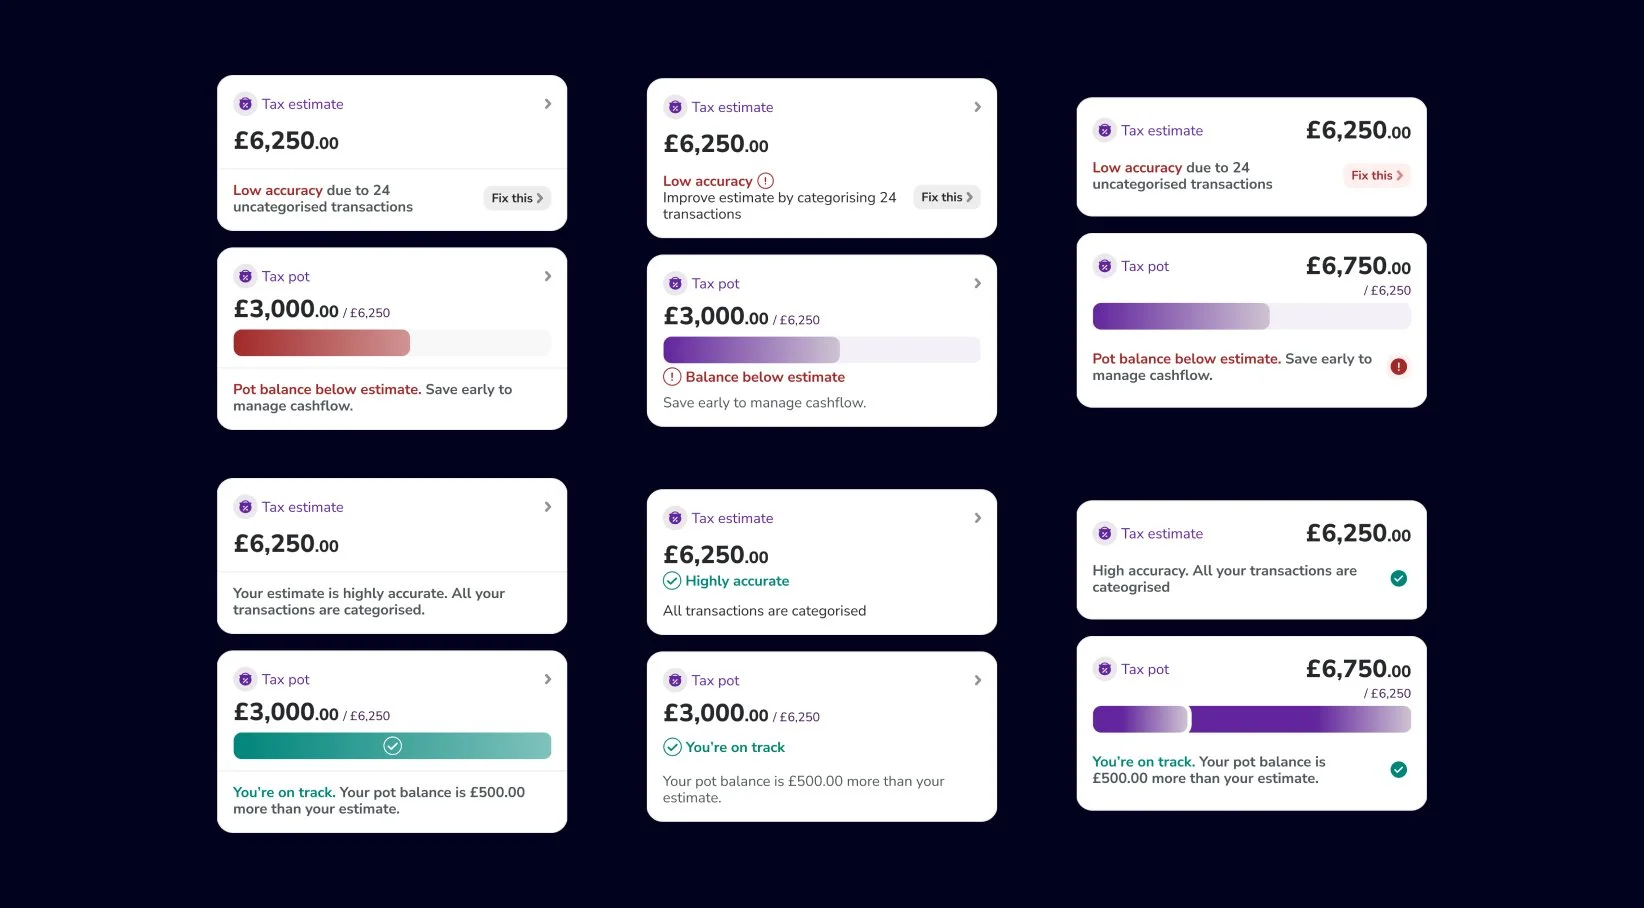
I explored a wide range of ways to present this content. Through a few rounds of discussion with the cross-functional team and the Head of Design, we narrowed the options down to two distinct routes to A/B test.
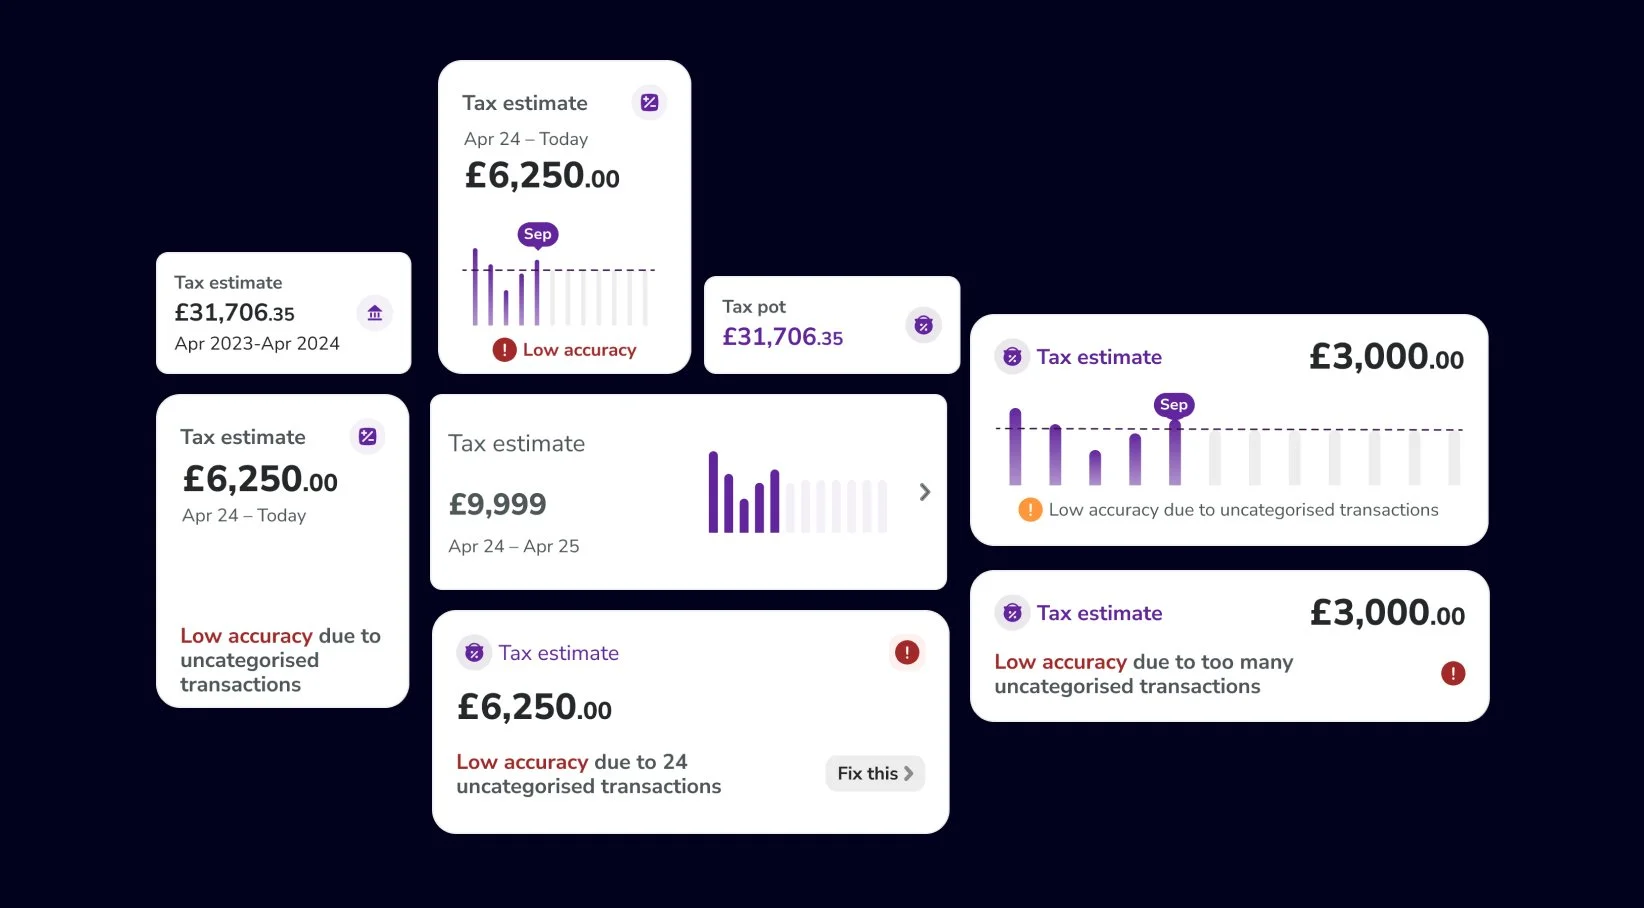
In parallel, I was ensuring that all new designs would meet minimum AA accessibility standards. This included updating the category icons to ensure sufficient contrast and clarity.
I then explored how this could look at higher fidelity. The initial exploration focused on how best to present the modules, whether as full-width sections or in a mixed-width layout, and whether to include visual aids such as graphs or summaries.
User testing
I ran an unmoderated balanced comparison test using UserTesting.com, targeting self-employed users – either sole traders or directors of limited companies – with 0–2 employees.
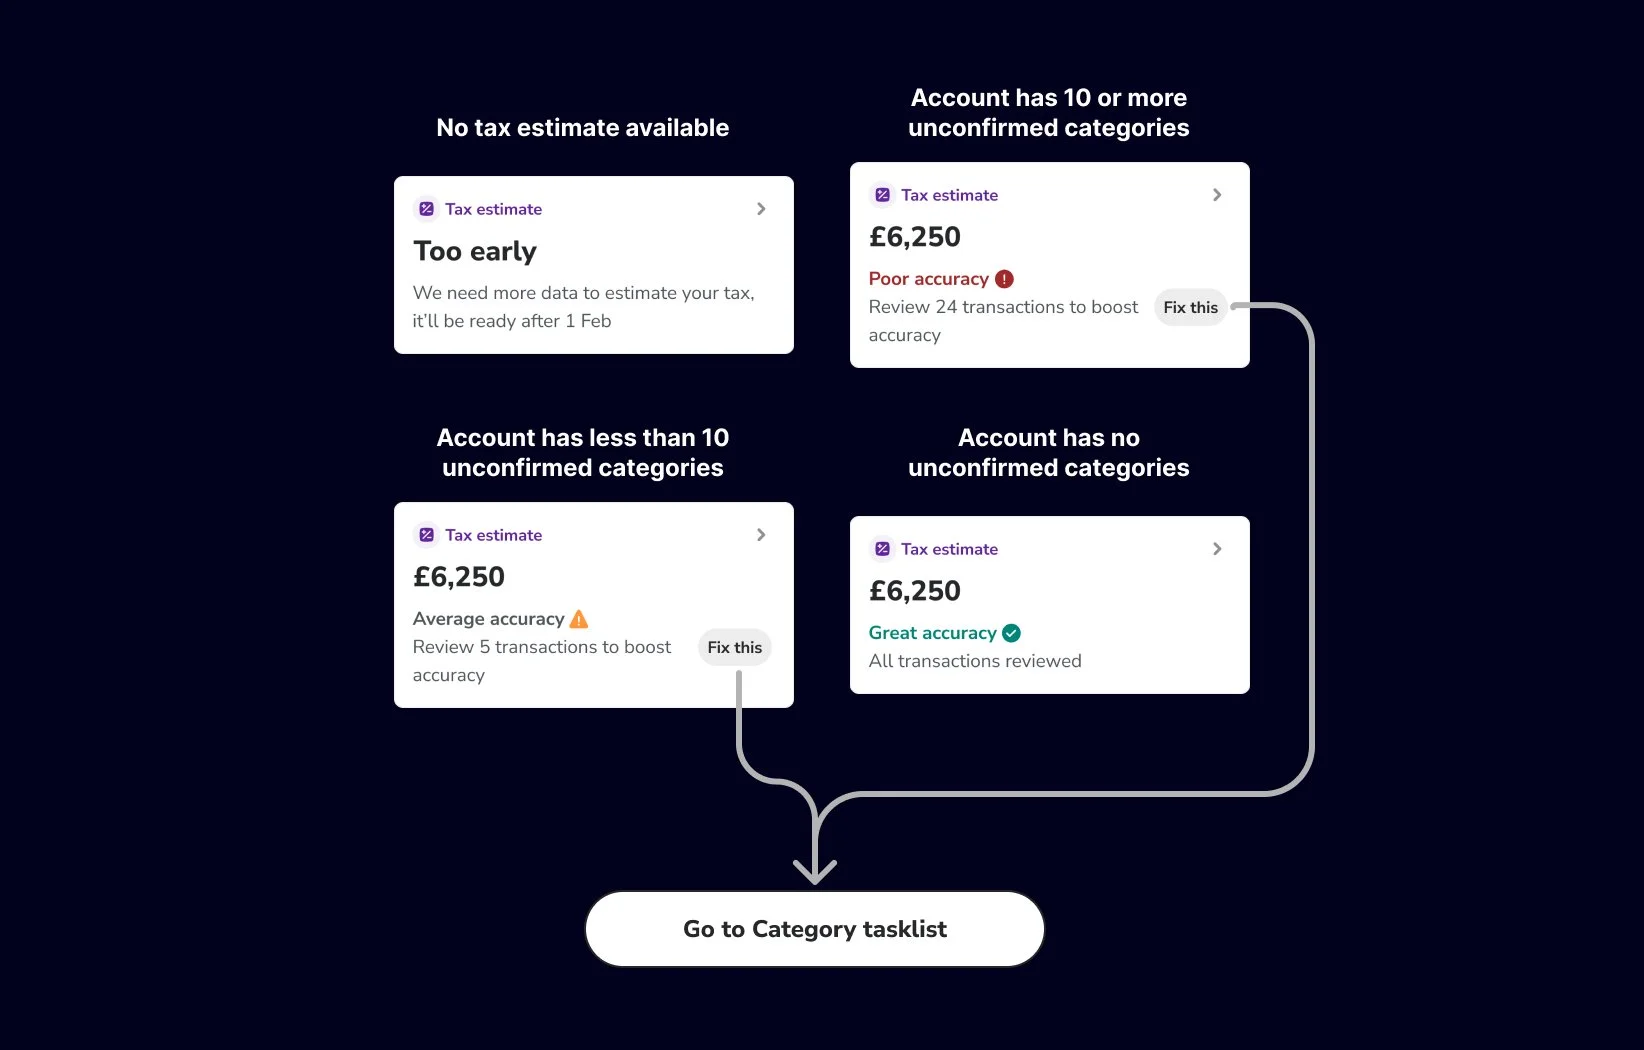
Most users preferred Route B, saying it was clearer and better supported them in managing their tax. They appreciated the inclusion of additional accuracy context, noting that it helped them understand at a glance why their tax estimate might be low and how to improve it.
However, users also noted that neither tax estimate graph felt particularly useful in practice. Since tax estimates tend to increase with earnings, and a tax-to-income ratio graph would eventually flatten (as tax is a fixed percentage), both graph types were perceived as limited in long-term value.
Several users reacted positively to the idea of an Accounting Score and accounting tasks, suggesting it could help them understand what they were doing well and what still needed attention.
The updates to the categorisation label were well received. All users were able to identify uncategorised transactions, and no usability issues were observed when navigating between the truncated transaction list and the full list.
Design development
Following the research, I presented the findings back to the team and we aligned on next steps.
The research gave us clarity on how users interpreted the information, what they found trustworthy, and where visual elements either clarified or confused the experience. In particular, the accuracy messaging in Route B gave users immediate context about how to improve their tax estimate. These subtle but deliberate choices helped us move from a generic dashboard concept to something that felt tailored, helpful, and intuitive.
We agreed to proceed with design Route B, including the addition of the accuracy status, along with contextual guidance on how users could improve it.
While feedback also highlighted interest in the Accounting Score and personalised tasks, we agreed to deprioritise these for a future iteration. Given the additional complexity involved and the time required to resolve the design, and the size of the initial release without these, we decided to reduce complexity in an MVP and focus the initial release on introducing the tax insight modules.
With a focus on using full-width modules, I continued to explore how best to present this information in a way that was both easy to understand and visually engaging.
Through several rounds of discussion with the cross-functional team and the Head of Design, we landed on a preferred route.
Final user testing
Taking advantage of the speed of unmoderated user testing, I ran another round using the final proposed designs.
The goal was to validate that no usability issues had been introduced through the design development phase. The results came back positive, with no issues observed, and the designs performed as expected. This gave us the confidence to proceed with development.
Preparation for development
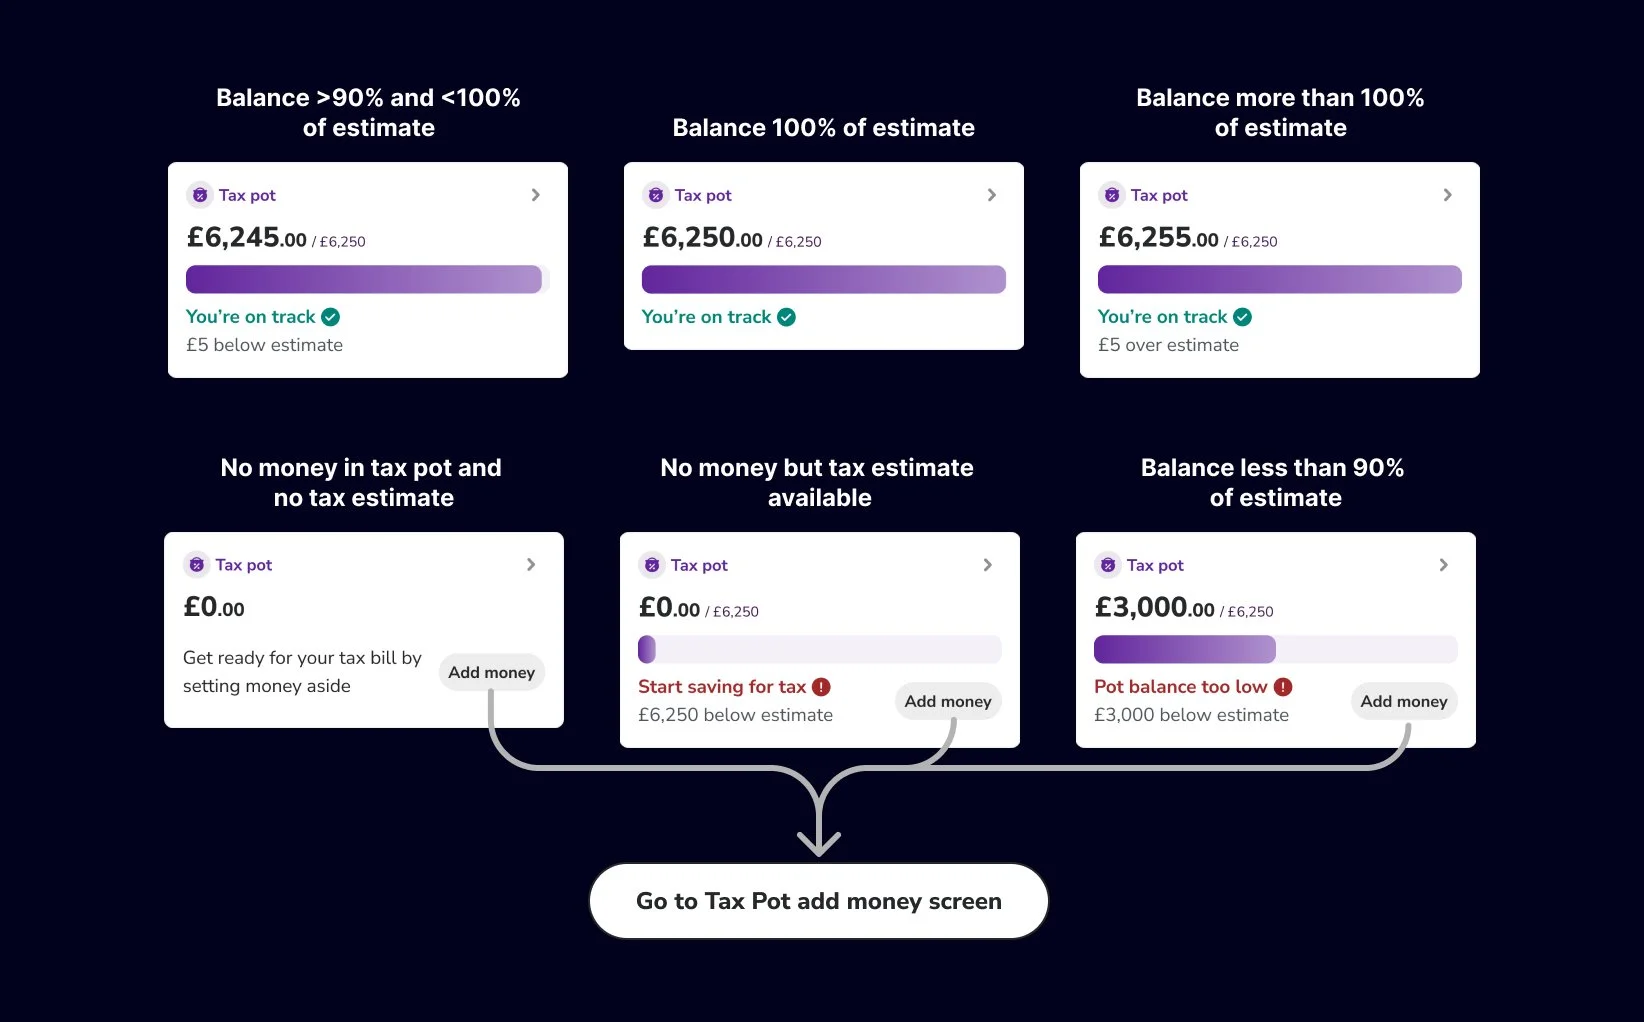
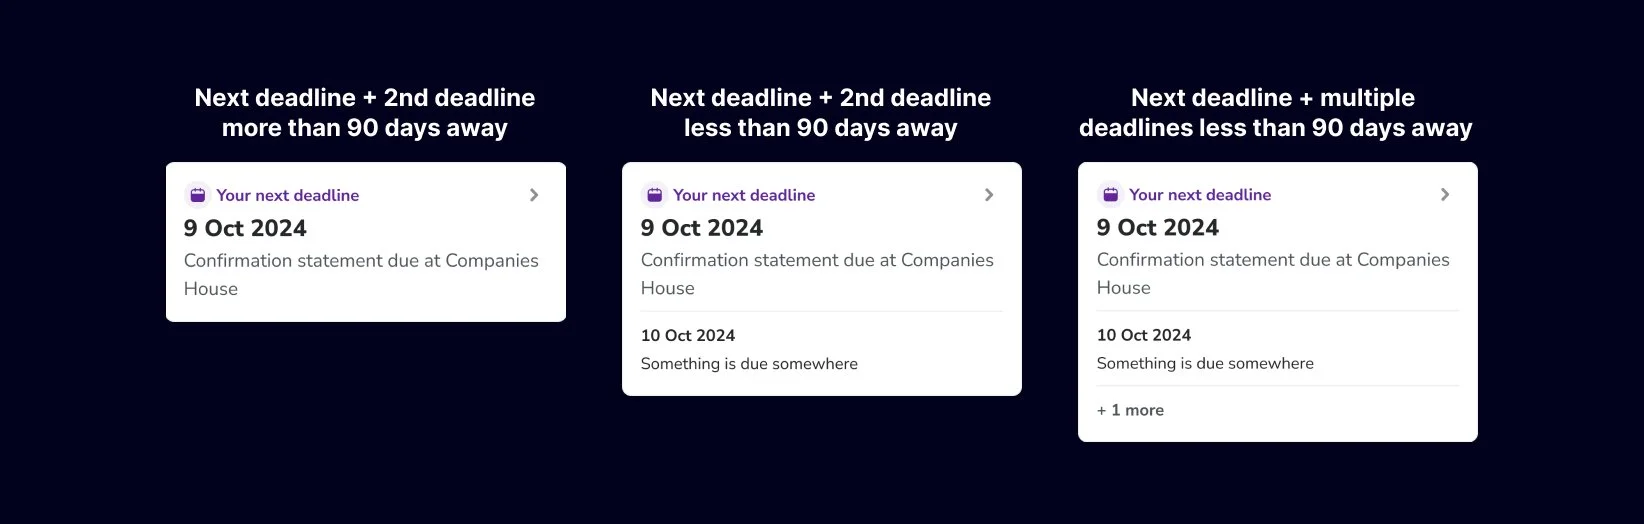
Once I had agreement on the final direction, I created all the necessary variants and ensured edge cases were accounted for.
This involved a combination of user journey analysis and close collaboration with developers to make sure all scenarios were covered before moving into development.
Release
We conducted a phased release; rolling out to 10%, 25%, 50%, and then 100% of users over a four-week period.
This approach allowed us to monitor adoption and performance closely, and ensured that no major issues emerged during the rollout.
Iteration 1 results
This release aimed to improve long-term retention by encouraging engagement with Countingup’s built-in accounting tools.
Since data showed that users who interacted with these features were significantly more likely to stay beyond their first year, our goal was to increase visibility and usage.
In the 30 days following the full rollout, we observed
4×
increase in views of the Tax Timeline
1.3×
increase in category updates
3×
increase in views of the Tax Estimate
1.5×
increase in Tax Pots created
These results indicated a meaningful shift in how users discovered and explored accounting tools, particularly tax features.
While actions like pot creation and category updates grew more modestly, they still contributed to exceeding our initial success target of a 1.5× increase in the use of accounting features. Due to retention being a lagging indicator, it was too soon to measure the impact here, but we expected these shifts to correlate based on historical patterns.
Next steps
Surfacing accounting features on the home screen was only the first step.
To drive deeper usage, we planned follow-up work that included personalised accounting tasks, an updated balance section, and relocating profile actions to the home screen. This was designed to move users from passive viewing to confident, recurring interaction.
This project laid the foundation for a more integrated, insight-driven home experience – positioning Countingup as a trusted partner in managing business banking and accounting.